Bitcoin and the Golden Ratio
After my post 'the Bitcoin Code' I went on to see wether the the so called "Golden Ratio", which is close approximate of the 5:3 ratio would deliver other or more interesting results like the one we found with the 5:3 ratio.

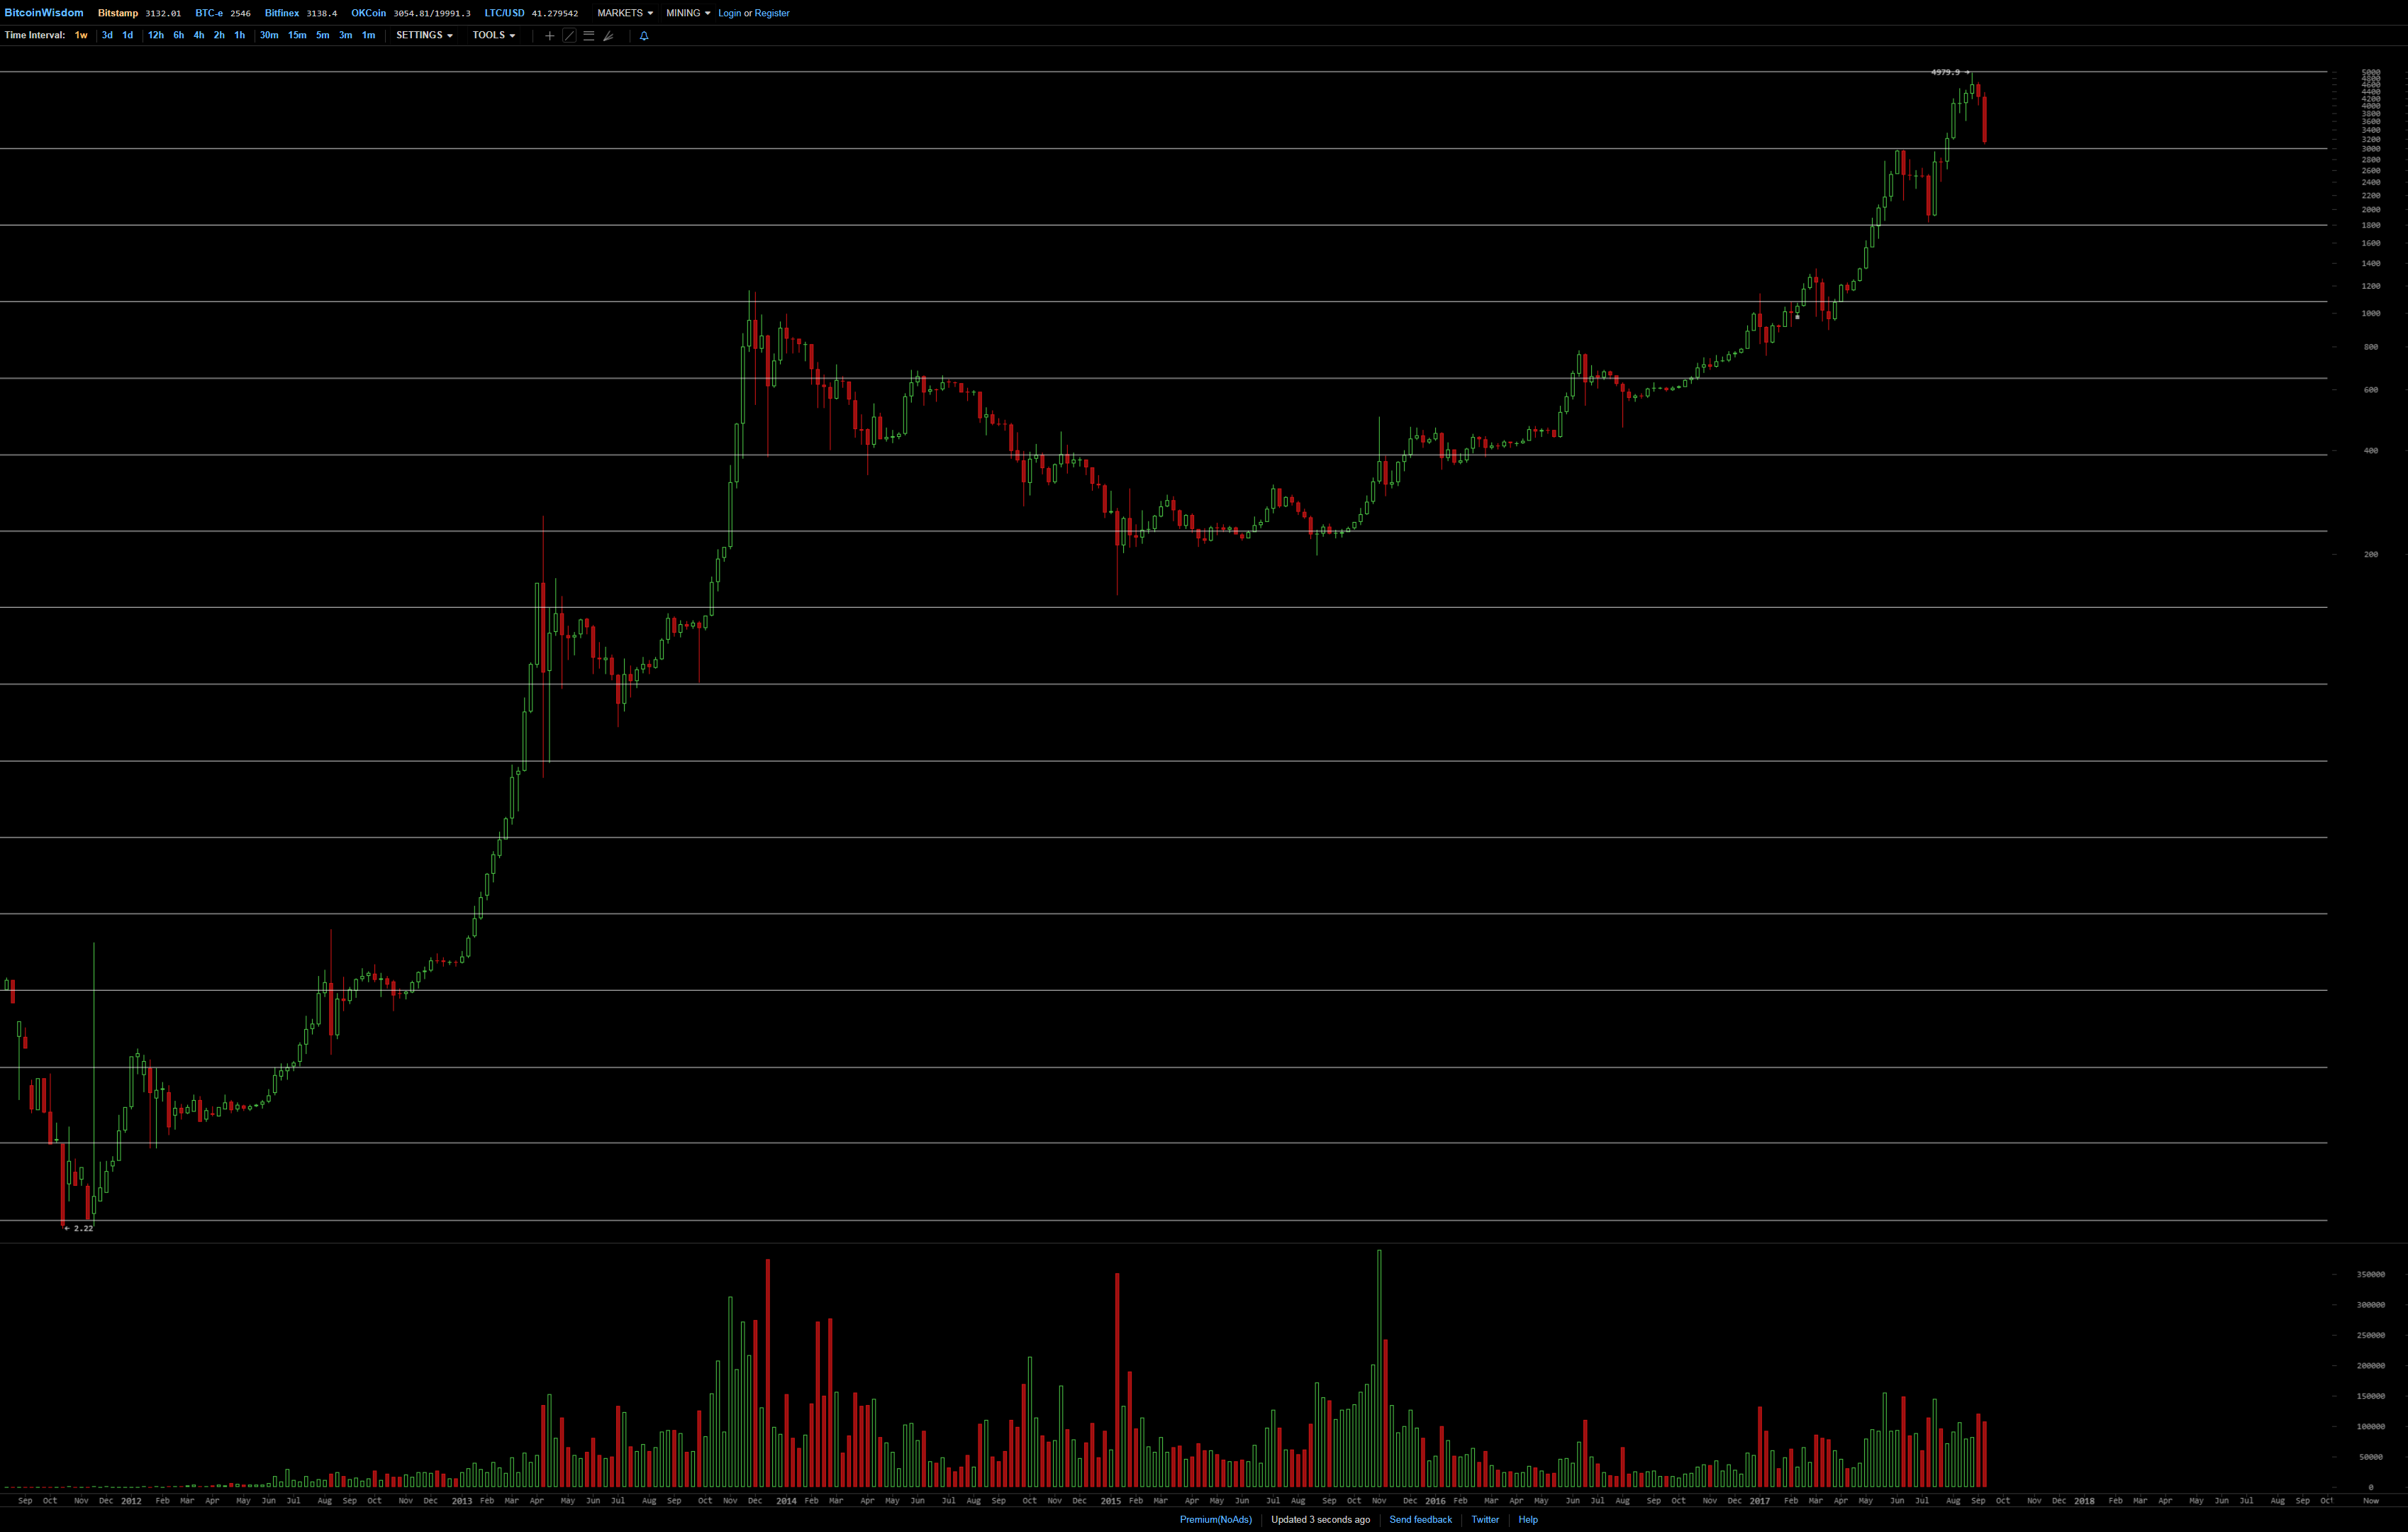
Using the same 'Benchmark' of 5000 this gives the following table

When we compare the charts, we see that the Golden Ratio seems to fit the Bitcoin curve even better than the 5:3 Ratio
5:3 ratio 1.66666
golden ratio 1.61803

See how precise the ATH's of 2013 and 2017 and other relative extrema find support and resistance on these 5000 mark based golden ratio levels
As an extra interesting fact, independent of the ratio's used :
when we connect the Low and High on the charts, it exactly hits the Low of the last U-turn:
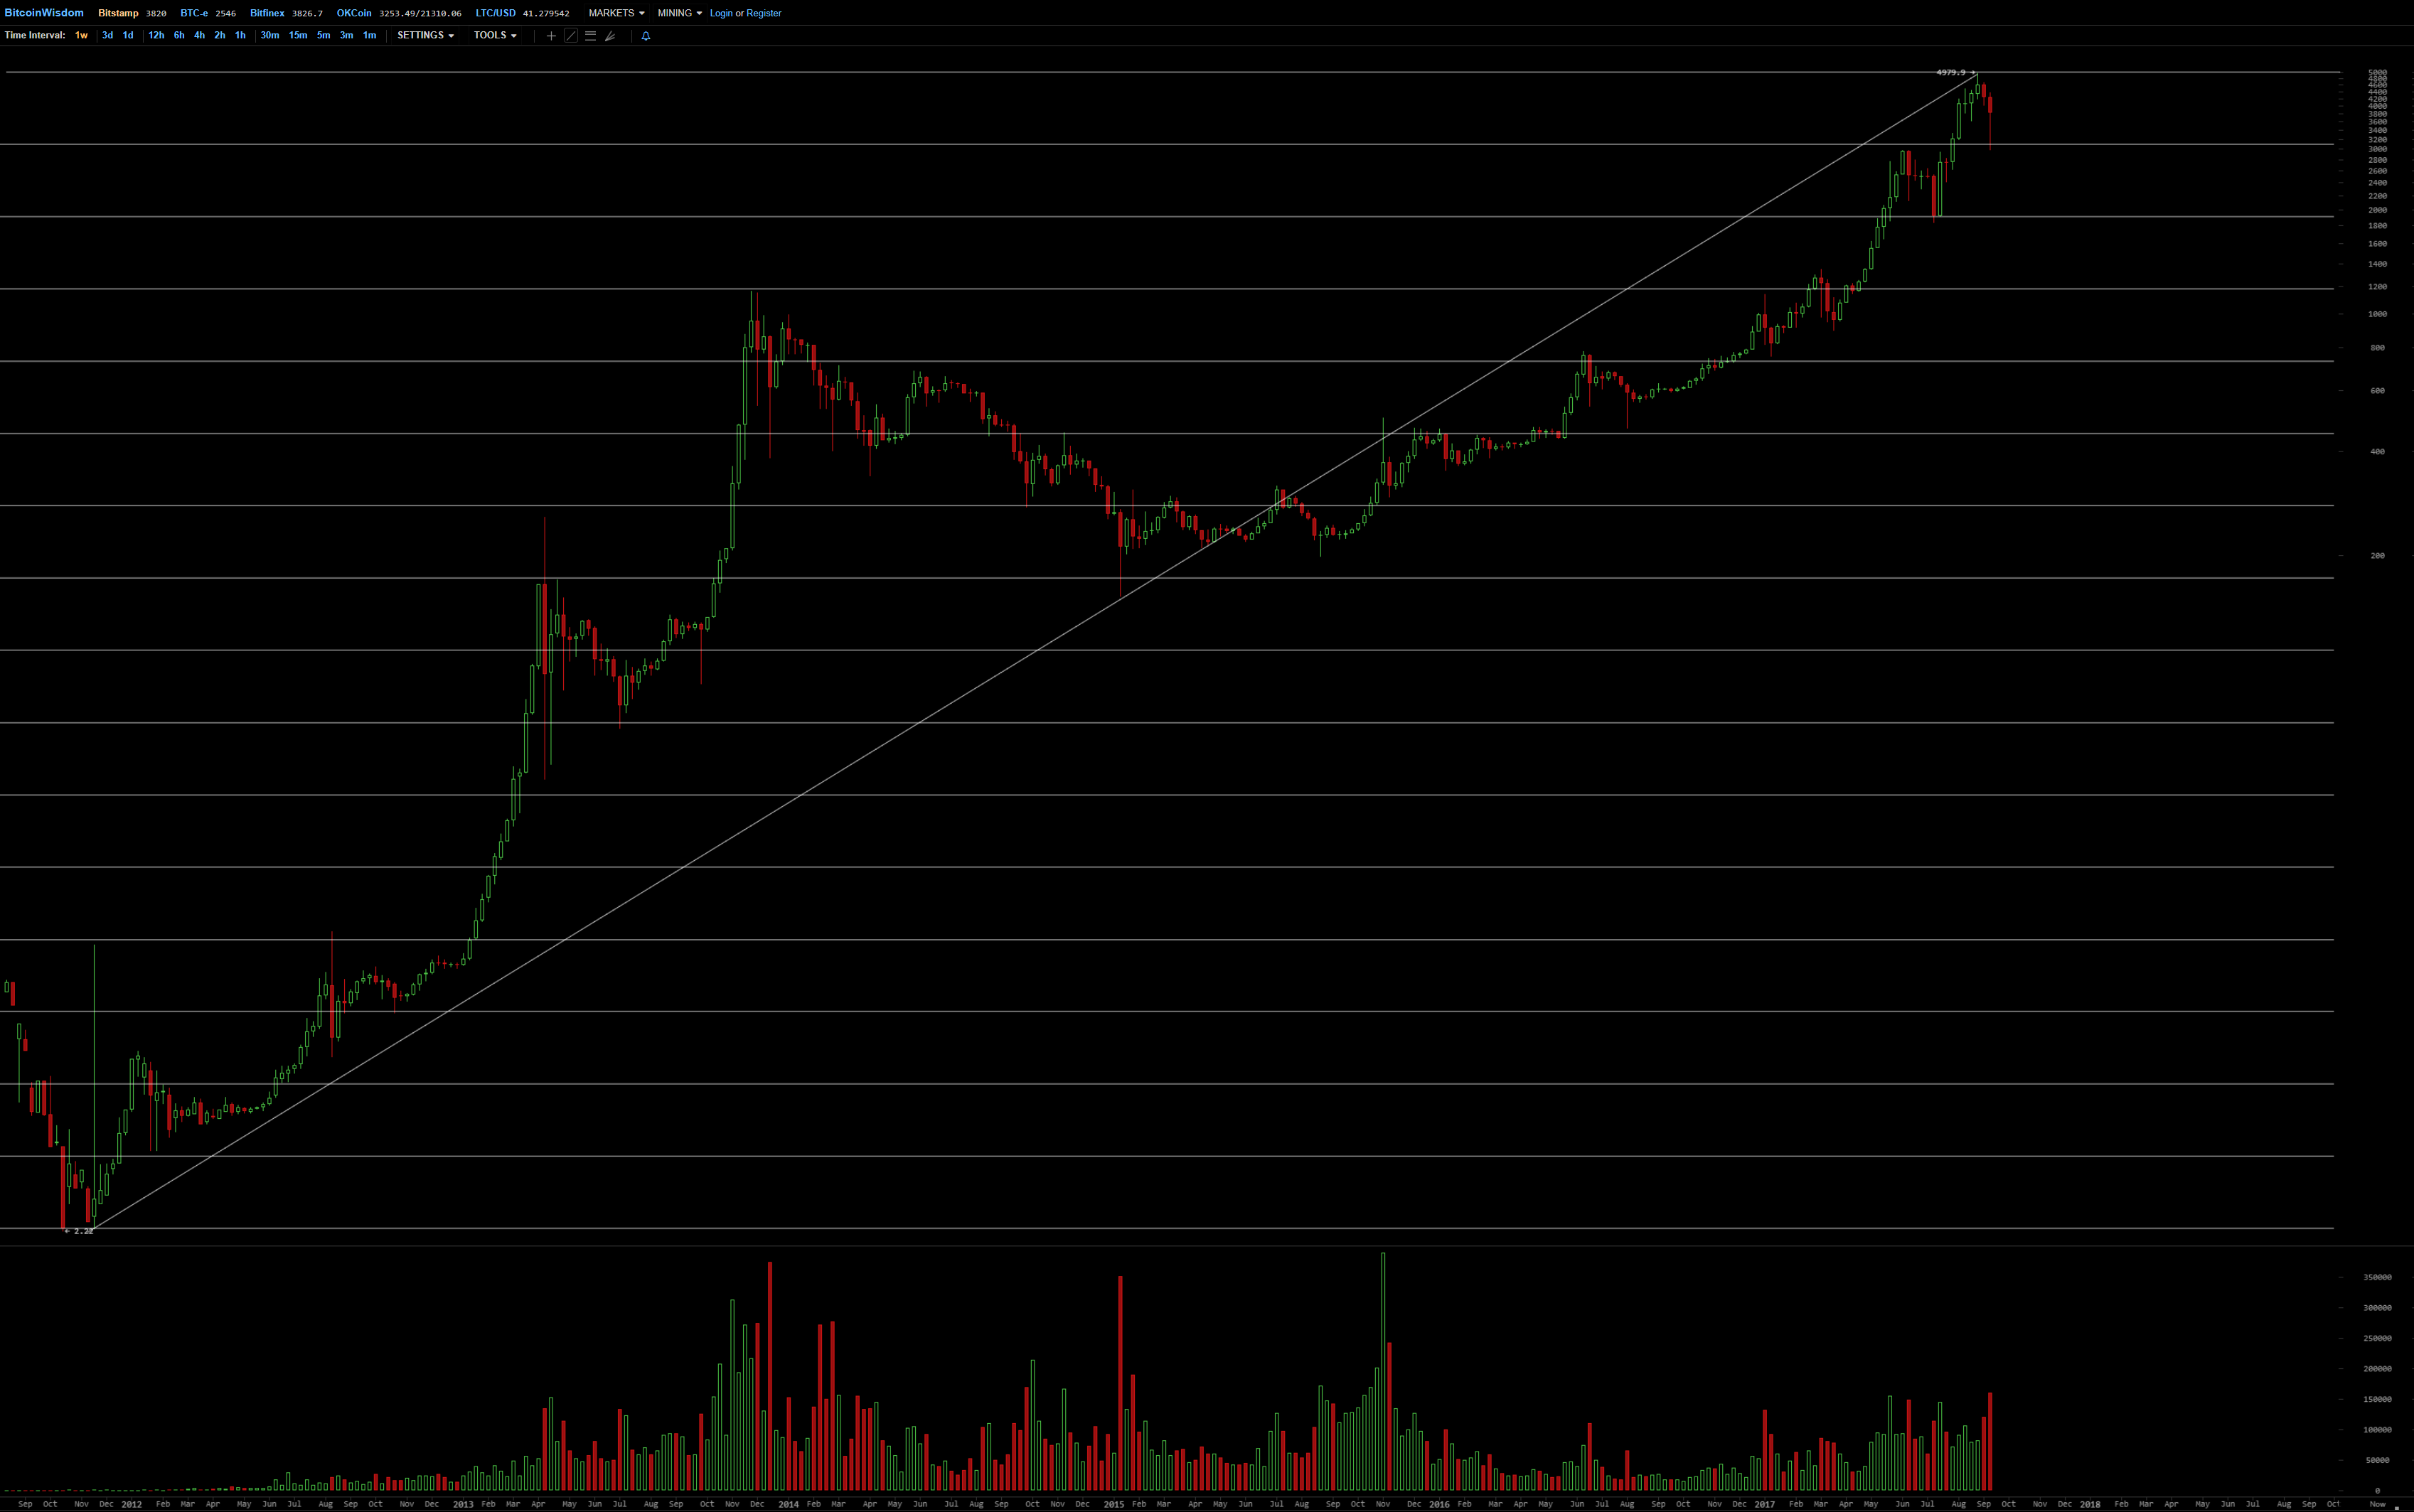
As a conclusion, I think we may say the 5000 usd Mark, together with the Golden Ratio, seem to play an important role in the general development of the Bitcoin curve.
looking to do some TA with the last ATH's of $11.6k with the golden ratios applied, how best to get in touch?
Tnx for your insight
my pleasure sharing :-)
@pagandance,
"When we compare the charts, we see that the Golden Ratio seems to fit the Bitcoin curve even better than the 5:3 Ratio"
OMG this is something we should concern about! Both are showing the same pattern :O How could it be possible! Wow thank you very much for sharing such an amazing comparison! Really appreciate your effort!
Cheers~
If this Golden Ratio pattern continues, we can now already say with confidence the next ATH will be at 21180, because as you can see, the ATH's follow each other in steps of 3, except for the one in 2012 which made 6 steps or 2 x 3 steps at once.
be good to see how the predictions played out and what new TA we can do
Now that's is something great analysis i have seen you have digged in more deeper brilliant
Yeah, there is too much interaction with this ratio based on the 5000 mark, than it to be just coincidence. Guess the big traders use these tricks already for ages to determine where to put in buy or sell power. And why especially 5000? I think personally 5000 is a much more beautiful number than 4000 or 7000 or 10000. Why? Don't know, it's just a feeling :-)
Maybe this 5000 marks the 'half-way point' for Bitcoin? In that case it would mean that 2009-2017--- somewhere in 2025 Bitcoin will stabilize at its final value?
@pagandance - oh my goodness, i'm not good in maths Sir. But something hidden there Sir. Nice article Sir. Therefore, I wish to ReSteem your post.
+W+ [UpVoted & ReSteemed]
Thanks !
wow............such a great analysis ,its amazing,just keep it up...........
hope it can be of some help in the future
you found something of very natural and amazing thing :)

who keeps searching will find
Few of the things went up my head but as for i can say some people are meant to be Analyst :)
but i get that Bitcoin has a great future ahead ,this is just a small obstacle :)
:-)
LOL
Its works but i still dont know why.
Self-fullfilling prophecy? Traders that watch out for 'Fibonacci' levels - the golden ratio is one of the most important of the fib levels. But when you compare the lines on the charts for the 1.666 they look like a standard costume, while those of the 1.618 look more like a tailor made costume.