Bitcoin BTC Jan 26 Morning Update - BTC Consolidations Nicely with Bullish Signs Showing

Is BTC Consolidation Almost Over?
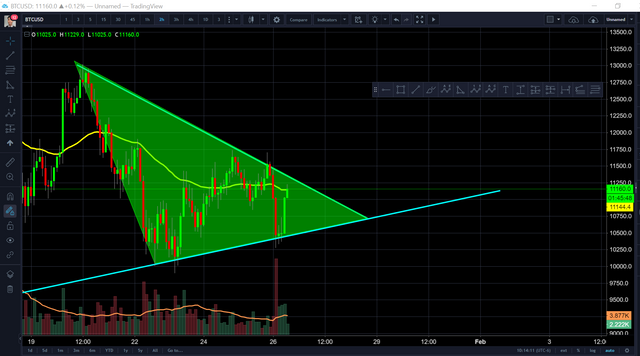
We see BTC wedging nicely and is itching for a breakout.
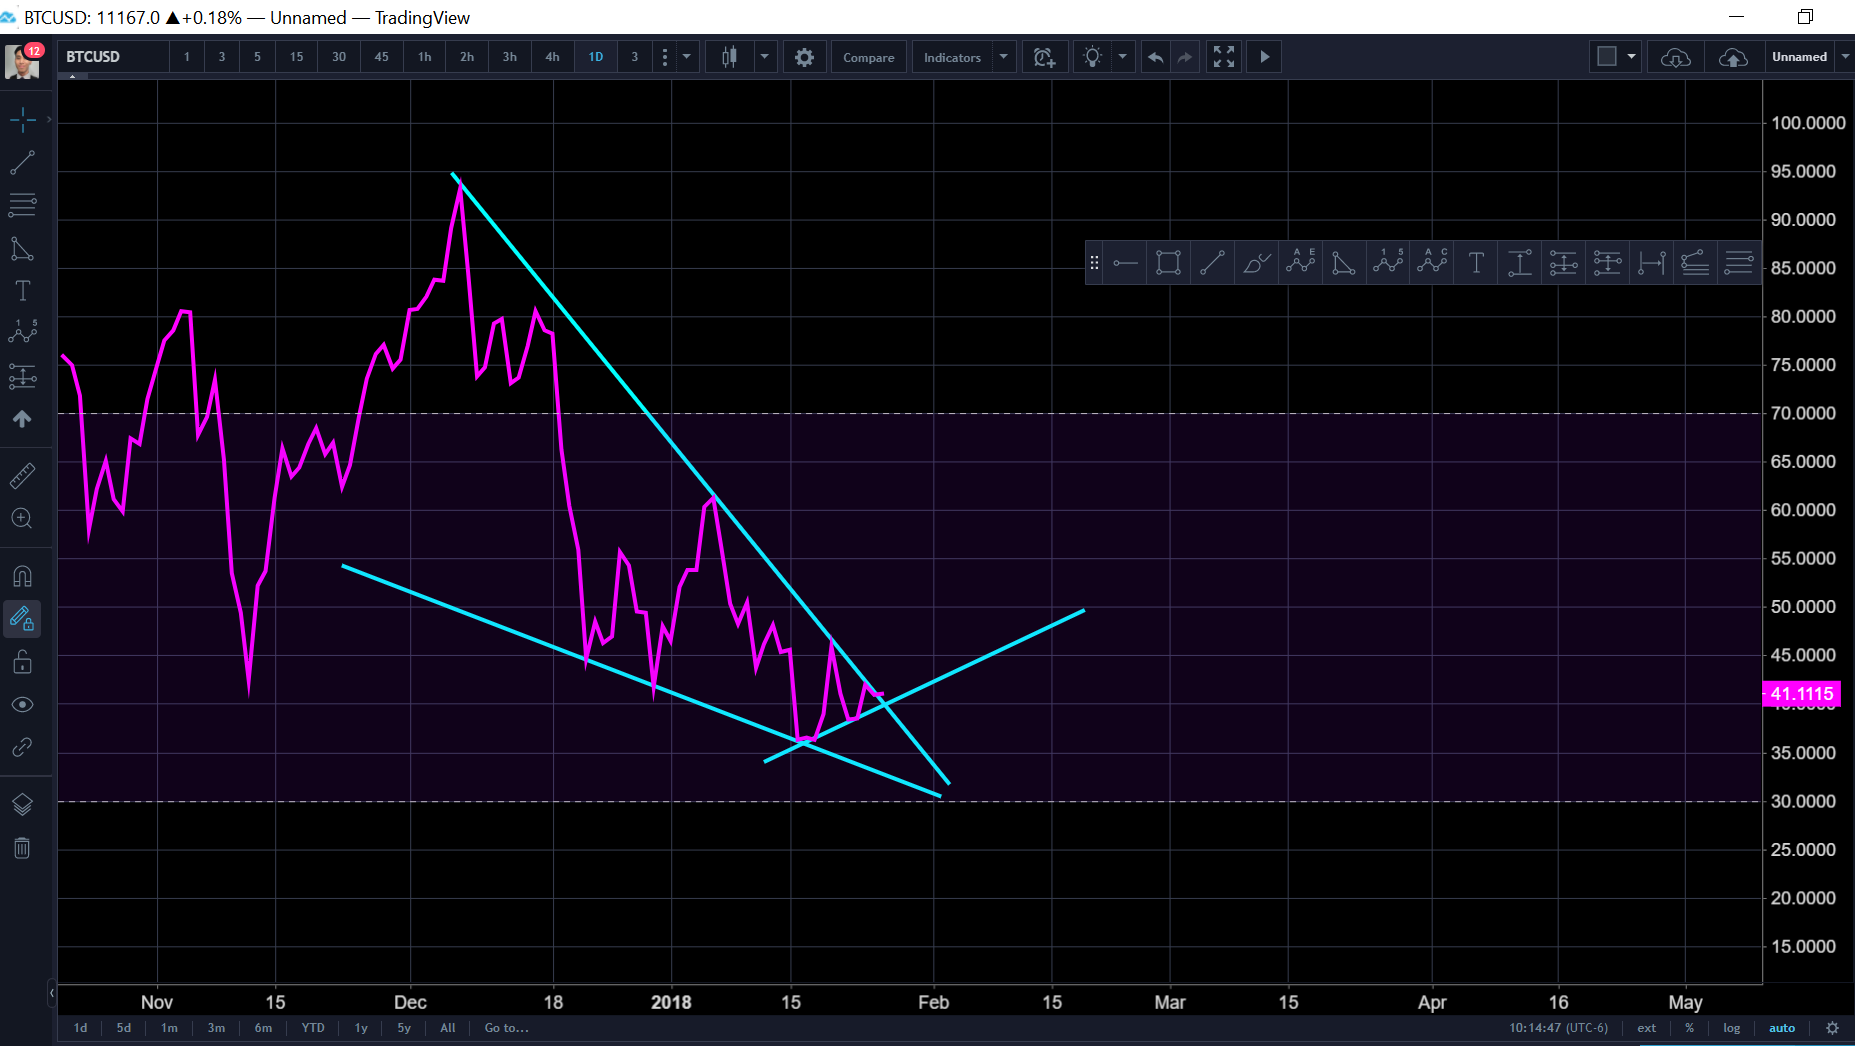
The daily RSI chart shows signs of breaking out of the wedge, and has higher lows as support.
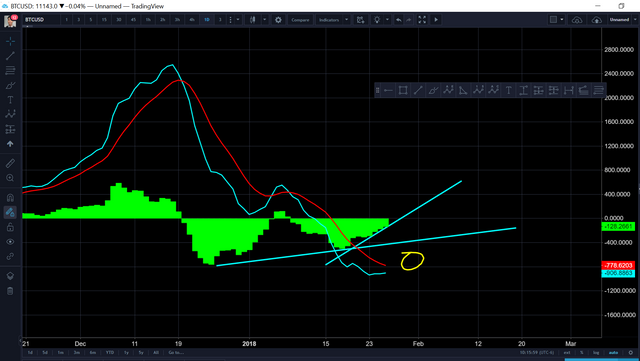
The daily MACD also shows signs of support with anticipation of a crossover. We see bullish signs of divergence on the histogram.
Always be cautious, take high probability trades, plan entries and exits, stick to high reward low risk R:R setups. Good luck traders
Please consider these videos:
Lesson 1 - Bitfinex Tutorial - How to Customize and Set Up Bitfinex
Lesson 2 - How to Analyze Candlesticks Charts with Strategy
Lesson 3 - Moving Averages
Lesson 4 - Relative Strength Index RSI with Advanced Strategy
Lesson 5 - MACD and Histogram
Lesson 6 - Margin Trading Long, Short, Leveraging
Lesson 7 - Basic Risk Management
Lesson 8 - Fibonacci Retracement Part 1
Lesson 9 - Fibonacci Extension Part 2
Lesson 10 - Laddering
Lesson 11 - How To Interpret Time Frames
Lesson 12 - Swing Trading Advanced 55 EMA Strategy
Lesson 13 - Introduction To Elliot Wave Theory
Twitter - https://twitter.com/PhilakoneCrypto
Youtube - https://www.youtube.com/user/philakone1
If you enjoyed this video, please like, subscribe, follow, share, upvote, or donate to Luna!
Luna's personal bitfinex account:
BTC address: 1PruhmsYXU2gPkNw574xZSMyBG4YW5Wnq9
Ethereum: 0x2538b728f9682fc1dc2e7db8129730f661753850
LTC: LPeaZpGiF3XdCw5XPN7LXztDagTEZAMgYd
Bitcoin Cash: 1AY2FPANCe5URB71Nvy6tkCgoTS8iHgmZD
The ultimate goal is to help the crypto community because I think there's a lack of these type of videos. I want to share everything I've learned because knowledge is only power if passed on. These are educational videos intended to teach how to think through thought-out rationalization.
DISCLAIMER:
Legal stuff here. I'm not financial advisor. This is just my opinion that I'm sharing with the community. All information is for yours to process how you wish.
Oh man, I was counting the waves meticulously expecting it to break down the 10400 and continue the yellow circle wave 5 downward. Then saw the price bounced back to the blue dotted line which is the crucial level where the "wave 4 should not overlap wave 1" rule applies....and it hovered around that blue line for a while and BAMMM it shot up to where it is now....
In cases like this, if the wave 4 DOES overlap the wave 1, does it mean that I've counted wrongly? Or does it mean Elliot wave is not always 100% true? I mean, maybe the theory is "always" true but just that I've counted wrongly?
But I have been verifying all my counts down to the minuscule level to ensure all the fib levels are correct, and all waves have 5 subwaves, etc...
I know you don't like to correct other's on their mistake in counting, but perhaps do have a series of videos in future where you take some other charts and point out the mistake that were being made, I think learning from mistakes is also a great way to learn elliot waves too. Thanks for your consideration!!
For what I know , in that case it can be a zig-zag, a 535, or a flat, a 335, of lower degree. it means it's a more complex correction ..., this btc correction is really complex anyway ...
The 1Hr Doji candle makes me think more bear, but it was definitely looking bullish for a sec. This consolidation could also be whats needed to push lower. But it could just be consolidating.
yeap looking good if south korea trading again phila thank you
With love,
harj : ) xoxo
Abstract artist
Love your stuff Phil. Keep up the good work!
I dont mind a lower low, as long as there will be another high. I hope you see that right.
Oh my gosh, my dog is freaking out with your dog!!! haha
haha. my dog likes to guest star sometimes.