First steps with Technical Analysis #2 – i.e. technical analysis for Housewives
After the introductory lesson, today we begin to see a bit how the technical analysis really works.
First let me explain the title that speaks of housewives. Don't think bad, it's not to disqualify anyone. Indeed.
But just the other day an housewife, friend of mine showed me a game for tablet of an unprecedented complexity kingdoms, production, mechanics complessissime also economic on resources, guilds and clans, voting.. In short, maybe it's easier to trade:-)
Anyway.. Let's start !
Golden rule to make trading: patience
Doing trading is like playing chess.
It's thinking of a strategy making moves and then paying attention to the turn of the market. This is trading.
Change ten times idea, get panicked because something fell 10 euros, forget what you had thought an hour earlier, in short are chess with one that continually touches the pieces? :-)
That's not trading. It's getting hurt yourself by throwing your money away. It takes patience.
You think, you still think.. You go to the bathroom you smoke a cigarette and you make the move.
Why am I talking about patience? To talk about the graph.
Often newbies make a huge mistake using a very small time frame like 5 minutes (or even one).
The Time Frame is in how many sections you compose our chart. Unless you do very special operations a TF so small you will never need anything. It is better to use 4 hours or 1 day even.
We try to understand why it is better: the technical analysis tries to understand and predict a mass of information.
The more information there is the more it makes sense the analysis you are doing. In a 1 minute chart, you just need two idiots to sell and can change a lot. In a 4-hour TF The two idiots will be hidden from the average of all other operations.
Clear? Nod... Well :-) Now that we understand this we are talking about the most important things that are in the technical analysis.
The Supports and Resistances
It's pretty trivial. The support is a price level, plotted by a straight horizontal, where the price found too much strength and failed to descend beyond that line. It's a support then at the price. It bears it and holds it higher.
The resistance instead is the opposite. A price level, where in the price that "would" go up test us but we can't smacked the muzzle.
How do you draw? Simple are the past. So if the value of BTC for example has beaten so much on a certain level that level is a resistance. If a resistance is exceeded it becomes a support.
This is a current BTC/EUR chart on Kraken.
The graphics system is tradingview. (www.tradingview.com) The TF 1 day. I widened the whole thing to make us stay many months.
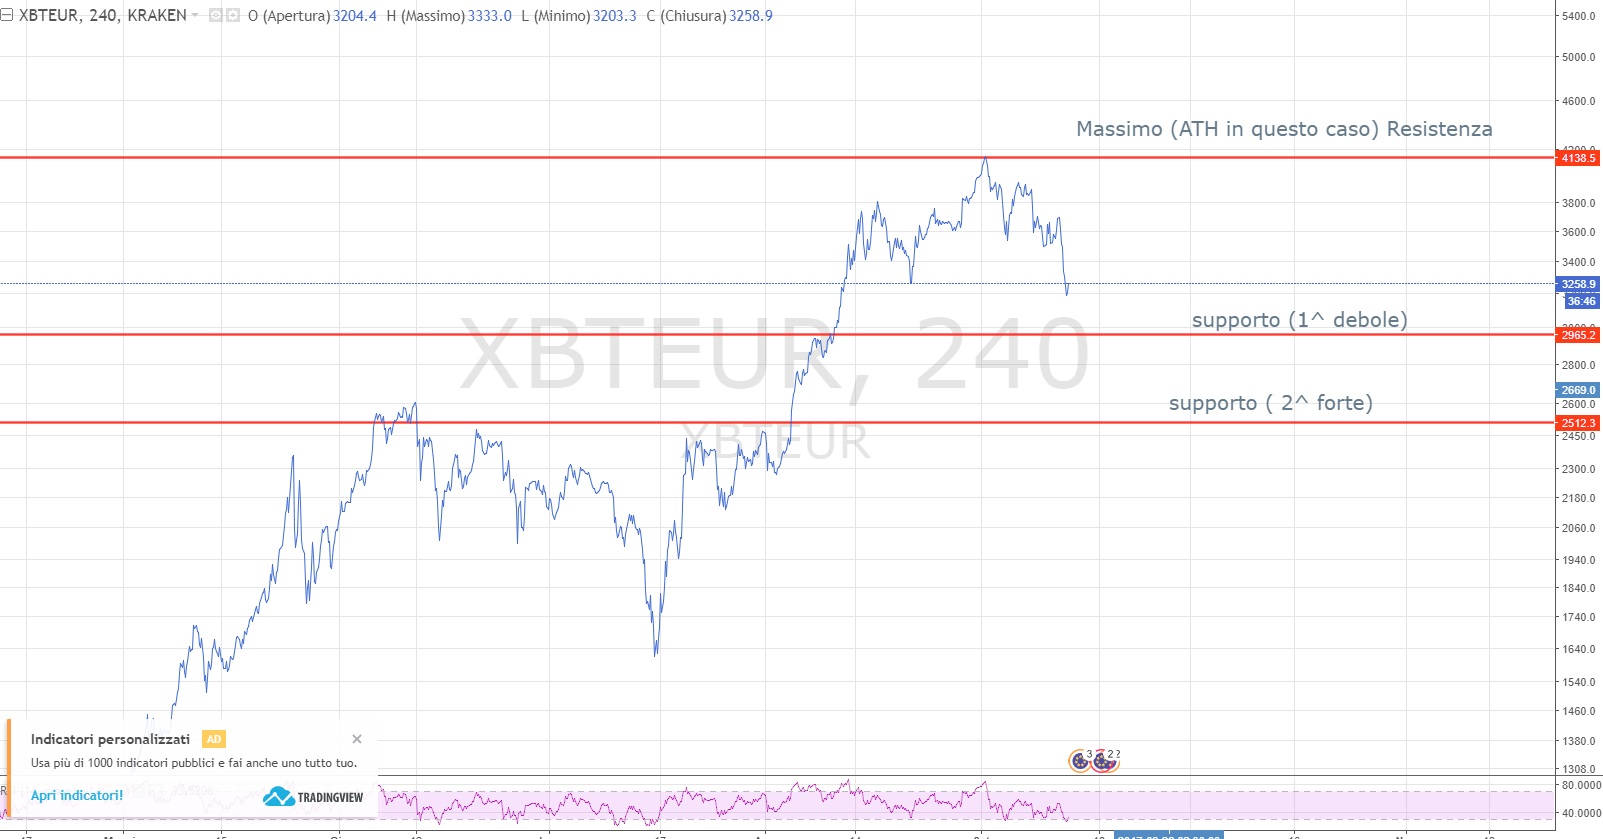
(Because this is the translation of my post in Italian and I did not want to remake the chart you see the "supports" written in Italian:-) next time, maybe, I do the charts. Maybe.. :-) )
We start from the bottom the second support with the strong inscription.
Do you see that in June the price has "slammed" on that level? He went back and then tried again and again until in August he broke it. Before August it was a resistance. After it became a support. Is it strong why?
He slammed us so hard and put us so far to overcome it.
I drew another one to €2965. It is less strong because the price has slammed us less times.
It may be useful to increase or decrease zoom and time frames to better investigate a section or a level i.e. understand whether it is really a support or not or how strong it is.
So the golden rule (the second we say) is this:
Resistance is a resistance until it is exceeded. Then it becomes a support.
It is also the opposite: a support if it is broken then becomes a resistance.
Why is that so? In Many people simply say it is just so and they are very good traders. But we who are very clever we think and say: because we are human so regular, stubborn and persistent.
I'll explain it with an example:
I think the right price to sell is 1000. Here's the resistance! If they buy they will have to buy these BTC too. If they do not buy in so many the price will go down without exceeding 1000.
But it reaches 1000. I sell and I'm happy. But... Goes to 1200....
I think exactly this: "Shit! I thought he'd get down now! But he will return to a 1000 of sure! "and stubbornly placed the purchase order at 1000 as before.
And here we create the support because the ones that they sell will have to pass even the purchase to 1000 of the example.
All clear?
Little advice. Tradingview is full of buttons options and other strange things. If you want to have simpler tools such as Cryptowatch (https://cryptowat.ch), throw an eye on it.
I like using Coinigy.com to do analysis since they condense down many of the major exchanges into one platform.
I always use Fibonacci Retracement, Bollinger Bands, and Stochastics to do my price forecast and analysis. Bitcoin conforms to Fibonacci sequences quite well I would say :)
Well.. Fibonacci and Stoch I think I'll put them in the next "lessons"...But if you're a Pro you shouldn't read lessons for beginners no? :-)