Lesson # 4 (RSI Indicator & how to use it)
Hello Steemians
Today is Saturday and you people know, we have lesson class every Saturday.
If you missed lession # 1, you can check here
https://steemit.com/bitcoin/@salahuddin2004/lesson-1
If you missed lession # 2, you can check here
https://steemit.com/bitcoin/@salahuddin2004/lesson-2
If you missed lession # 3, you can check here
https://steemit.com/cryptocurrency/@salahuddin2004/lesson-3-false-breakout-and-how-to-avoid-them
Today I would like to talk about (RSI Indicator & how to use it)
RSI INDICATOR: Relative Strength Index
The Relative Strength Index (RSI) is one of the famous technical indicators
that can help you determine overbought and oversold price levels
and generate buy and sell signals.
Two Common Conditions for RSI
RSI Potential Buy Signal
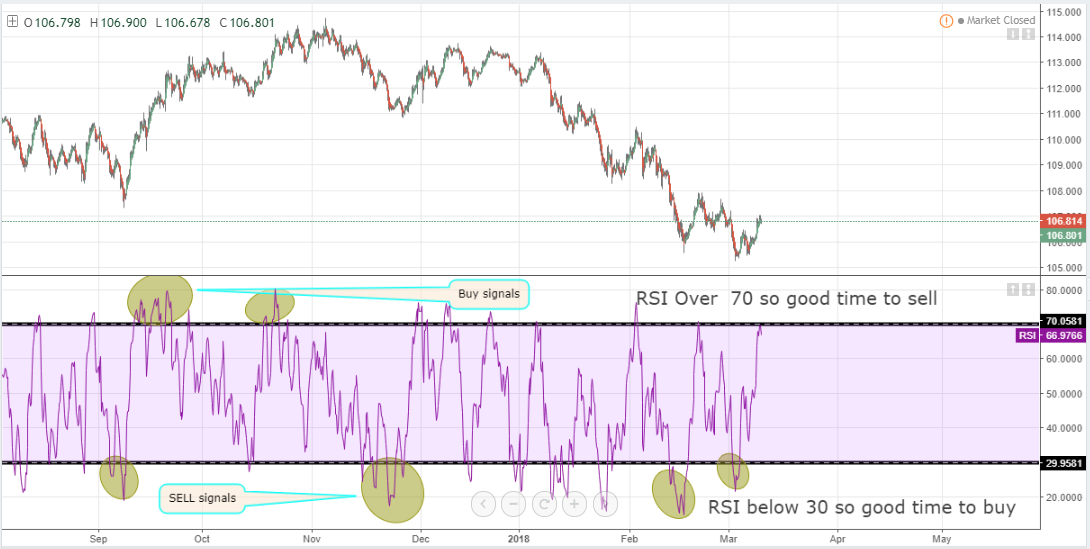
A trader might buy when the RSI crosses below the oversold line (30).
RSI Potential Sell Signal
A trader might sell when the RSI crosses above the overbought line (70).
More clear picture
I made one mistake in below chart (put buy signal logo
over 70 RSI & sell signals below 30 RSI)
Please don’t confuse.
My secret how I use RSI.
My secret
I use RSI with price candles to get accurate buy & sell signals
Look at chart how I use it
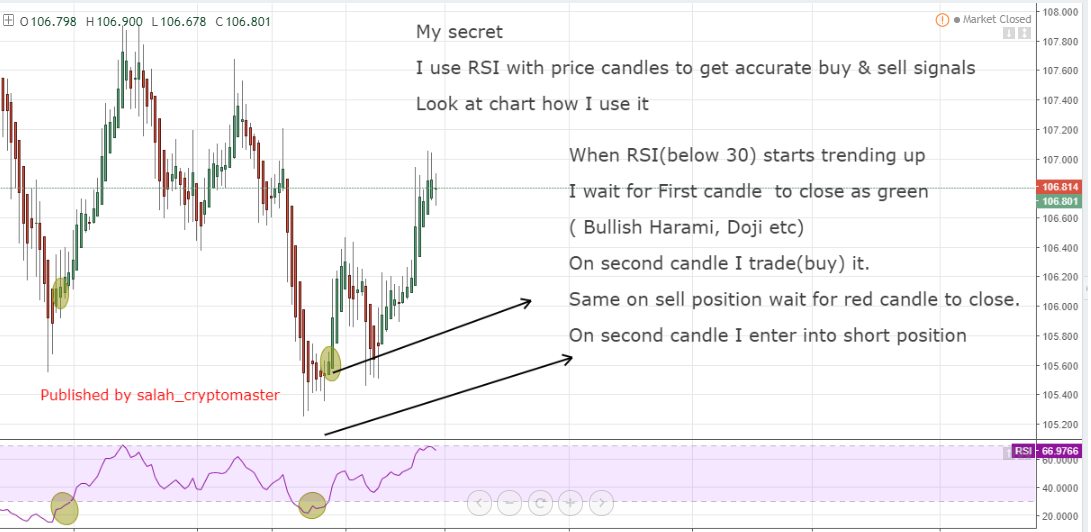
When RSI(below 30) starts trending up
I wait for First candle to close as green
( Bullish Harami, Doji etc)
On second candle I trade(buy) it.
&
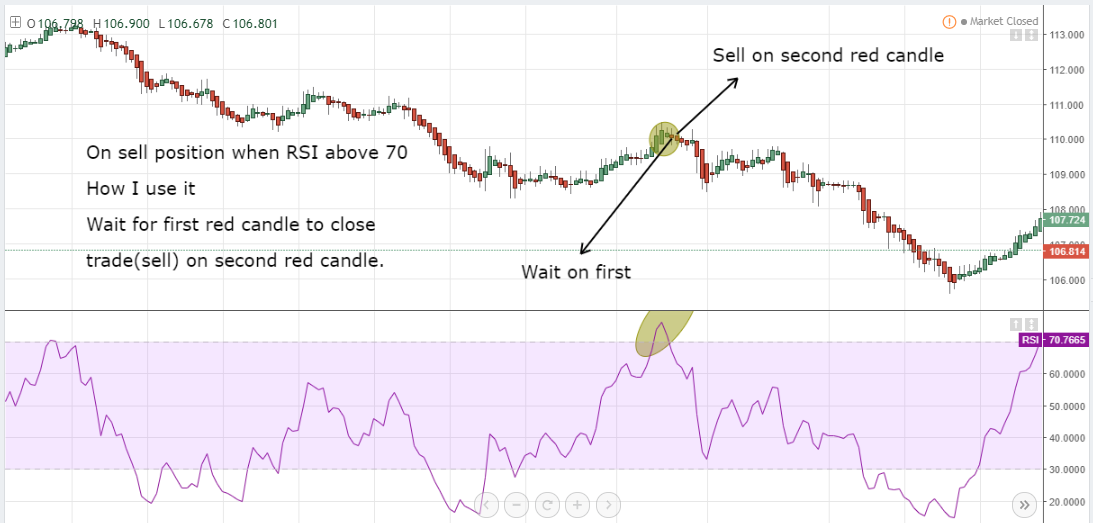
On sell position when RSI above 70
How I use it
Wait for first red candle to close
trade(sell) on second red candle.
Try all my this lessons while doing your TA. You will love it.
Lession # 5 will be on 17.03.2018
You would love to know that everyone can use this technique.
If you have any question kindly mention it in comment.
If you find it hard in practising it let me know in comment, I will go through it.
Resteem this post to help new investors.
Thanks
Thanks Salah!! Especially for your secret 😄😄😄
Can't wait, you are really a good teacher!
Everything is as clear and easy to understand as you explain it.
Take your time 004, you been doing a lot. We understand.
Best regards,
91
I am looking forward :-)
Strike 3?
Thank you.
Does is matter wich chart you take? What is the best one, 4 hrs?
But when you take the 4 hrs chart and use the RSI indicator with your candlelight secret than it takes a long time to see wich candles appear....
Dear @buttercups
I use 4hrs , 1 day charts for more accurate signals.
Wait for first candle to close then enter on second one.
You say: A trader might buy when the RSI crosses above the oversold line (30).
For me to understand you mean you might buy when it is UNDER the oversold line (30) for example 29, 28?
You say: A trader might sell when the RSI crosses below the overbought line (70).
Do you mean ABOVE the overbought line for example 72, 73?
Dear @buttercups
Was my mistake
Now I fixed that.
Below oversold line (30) it’s buy signal with second green candle.
Above overbought line (70) it’s sell signal with
Second red candle.
I saw it happen today :-) I watched the rsi it was around oversold 30 and than 2 green candles and than it went up strong above $ 9100,- and still rising.
It works, really nice to see!
Thank you, you see i pay attention :-)
I really like to learn about the indicators