BTC/USD chart analysis
As can be seen below, there is a bullish divergence on the daily chart.
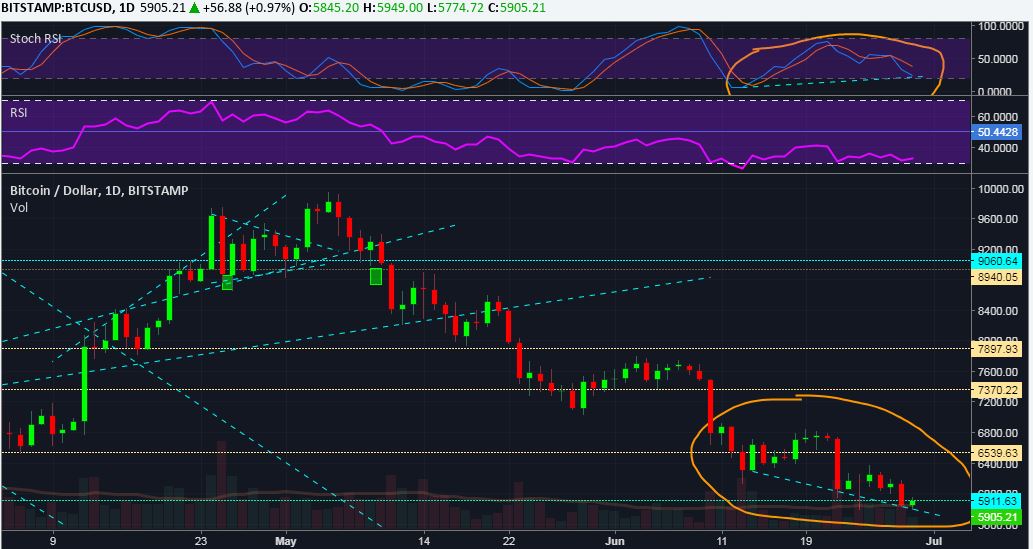
#BTC RSI heavily undersold while stochastic RSI is within undersold areas as well. Low-level longs between 5800-5900.
What does this mean? A bullish divergence means that prices have fallen to a new low while another oscillator moved in the other direction. In short, bears are currently losing their power. It is a textbook example for the end of a downtrend. Let's see how the market develops. I'm staying out.