LTCUSD - Technical Analysis October 12, 2017 - current price $57.50

LTCUSD
With BTCUSD on its way to the moon we are looking at LTCUSD as in our previous analysis, we were bullish above $55 and bearish below $49. When BTC makes giant strides there is always opportunity in the altcoins because of the sentiment correlation.
daily
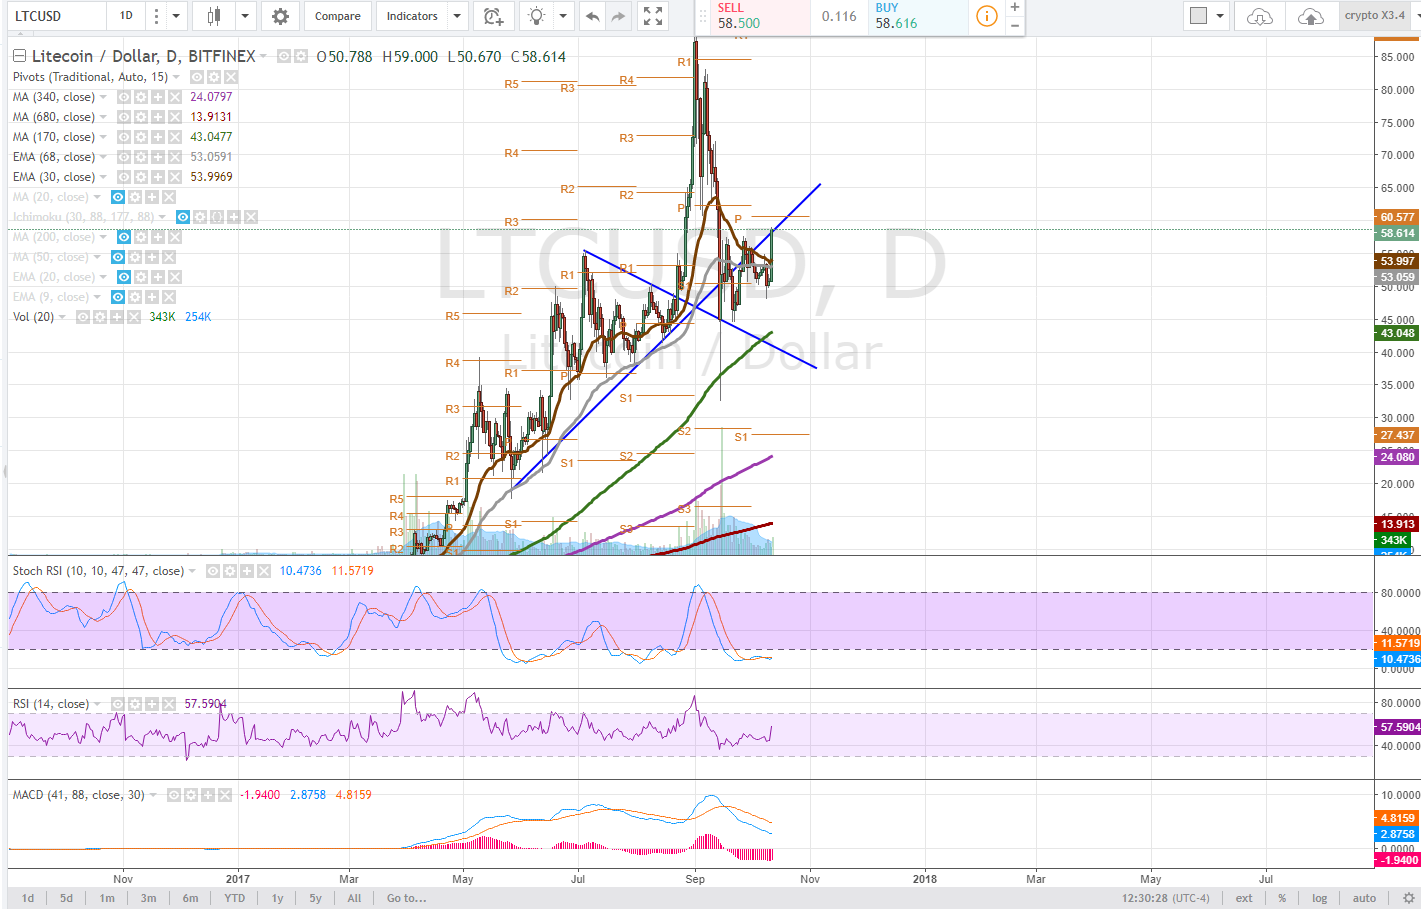
On the daily time frame, LTCUSD finally showed us some life as we have been tracking this sideways movement and were looking for a higher low to be set followed up by a test of the historic trendline.
The stochastic RSI has sharply curled up from oversold, downtrend conditions and has caused a similar spike in the daily MACD. Traders should b watching for the price to reclaim this trendline and those late to the party will be looking at this as an entry opportunity. After reclaiming the trendline, our next target is the daily pivot, $60.577.
4 hour
On the 4 hour time frame, we are watching the overbought RSI (which can stay in this condition provided the momentum is maintained). Not the Stochastic RSI has a lot more room to run and has caused a bullish MACD cross.
Support is found at 340dma (purple line approximately $56.85) - another entry opportunity if it holds. Major price support was found on the 680dma, red line, approximately $50.29. This is a must hold level.
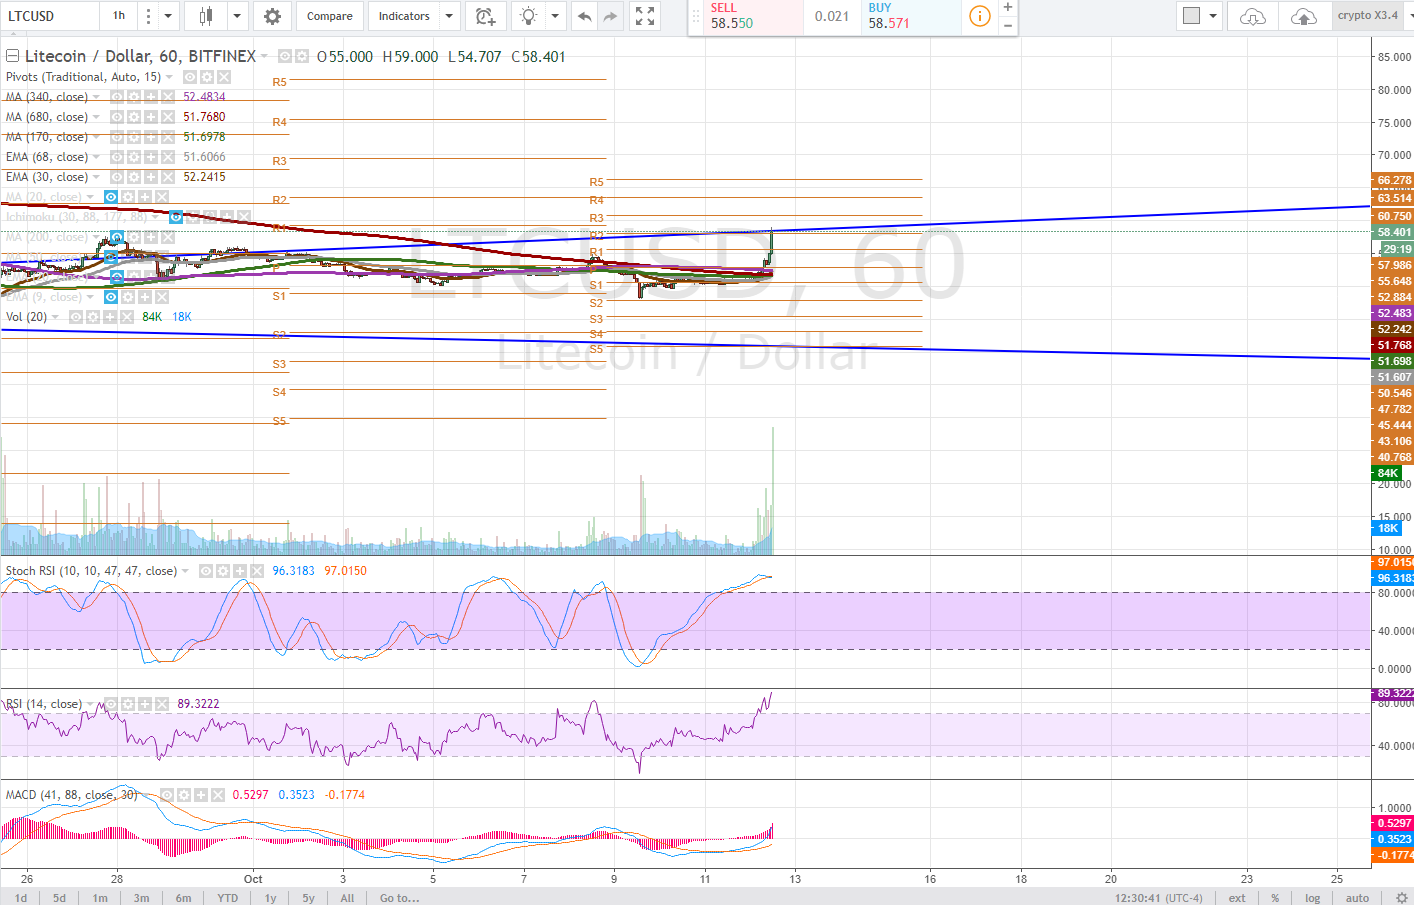
1 hour
On the 1 hour time frame we are observing an extremely overbought RSI and the STochastic RSI may show a slight bearish divergence while the price normalizes. Support is found at r1 pivot ($55.64).
On this time frame make note of the convergence of moving averages and their curvature upwards. A series of bullish moving average crosses would be conducive to bullish price action. These moving averages will act as support.
Bullish Above: $60
Bearish Below: $52
RISK TRADE: Accumulate a long position here all the way to 55, sell below $52 or set a % stop loss based on your risk tolerance. If LTCUSD fails to breakout here a retest of the lower trendline is likely.
Don't forget to use stop losses!!!
Previous Articles:
XMRUSD
ETHUSD
NEOUSD
BTCUSD
DASHUSD
ZECUSD
LTCUSD
Follow at your own risk, Not a financial adviser, understand the risks associated with trading and investing. Manage your own Risk - in other words you could lose it all and it's your own fault.


Nice post
Thanks a bunch! Hope it helps!
Nice👌👌👌 post.Thanks 👍👍👍you.💐💐💐
Great analysis. I have always had a soft spot for Litecoin and had to get out of it about 3 weeks ago as it was losing too consistently. Definitely a good time to reenter and sit on until the boost that will come when people liquidate out of BTC after the airdrop and hard forks.
Thanks for the intel! I have followed for more of the same and good discussion as things develop before the end of the year. I hope you will follow as well.
Hey no problem, technical analysis is all about knowing your levels!
Following & Upvoted! Nice Analysis!

I'm an Elliott Waver and Chart Pattern person and see a Bullish Ascending Right Triangle with target of potential $79.76; like this: