Bitcoin Back Above $11,000 [Bitcoin Price Update 2/19/2018]

Bitcoin strength continues as the price moves back above $11,000. BTCUSD looks to take out resistance at $12,000 and $13,000. A bullish moving average crossover on the daily chart would be extremely bullish for Bitcoin.
4-Hour Chart
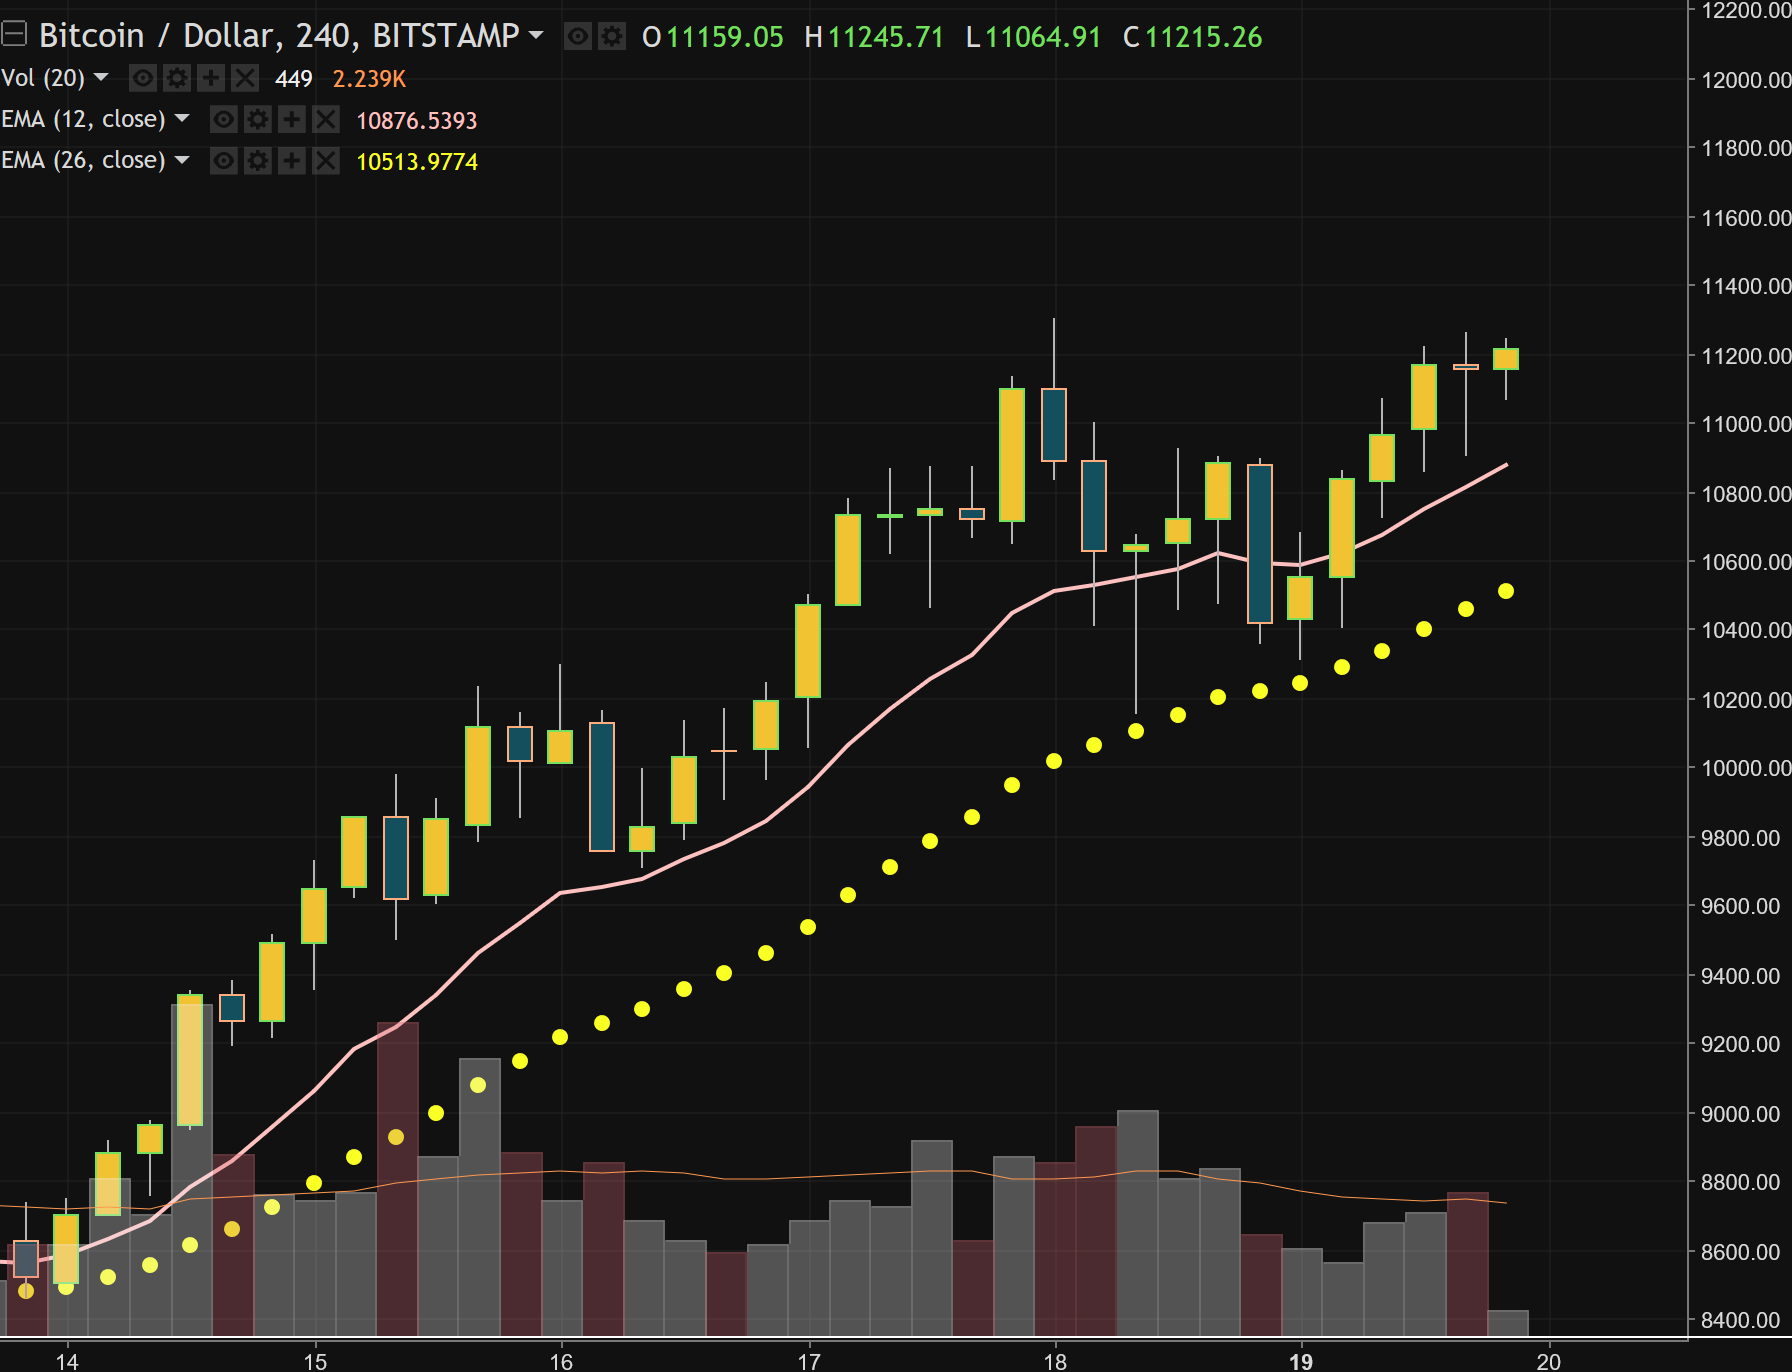
12 EMA: $10,875
26 SMA: $10,515
The 4-hour chart is strong with the BTCUSD trading above both the 12 EMA and 26 EMA. The 12 EMA is valued above the slower 26 EMA. These levels are now support, with $10,875 being the first line of defense.
Daily Chart
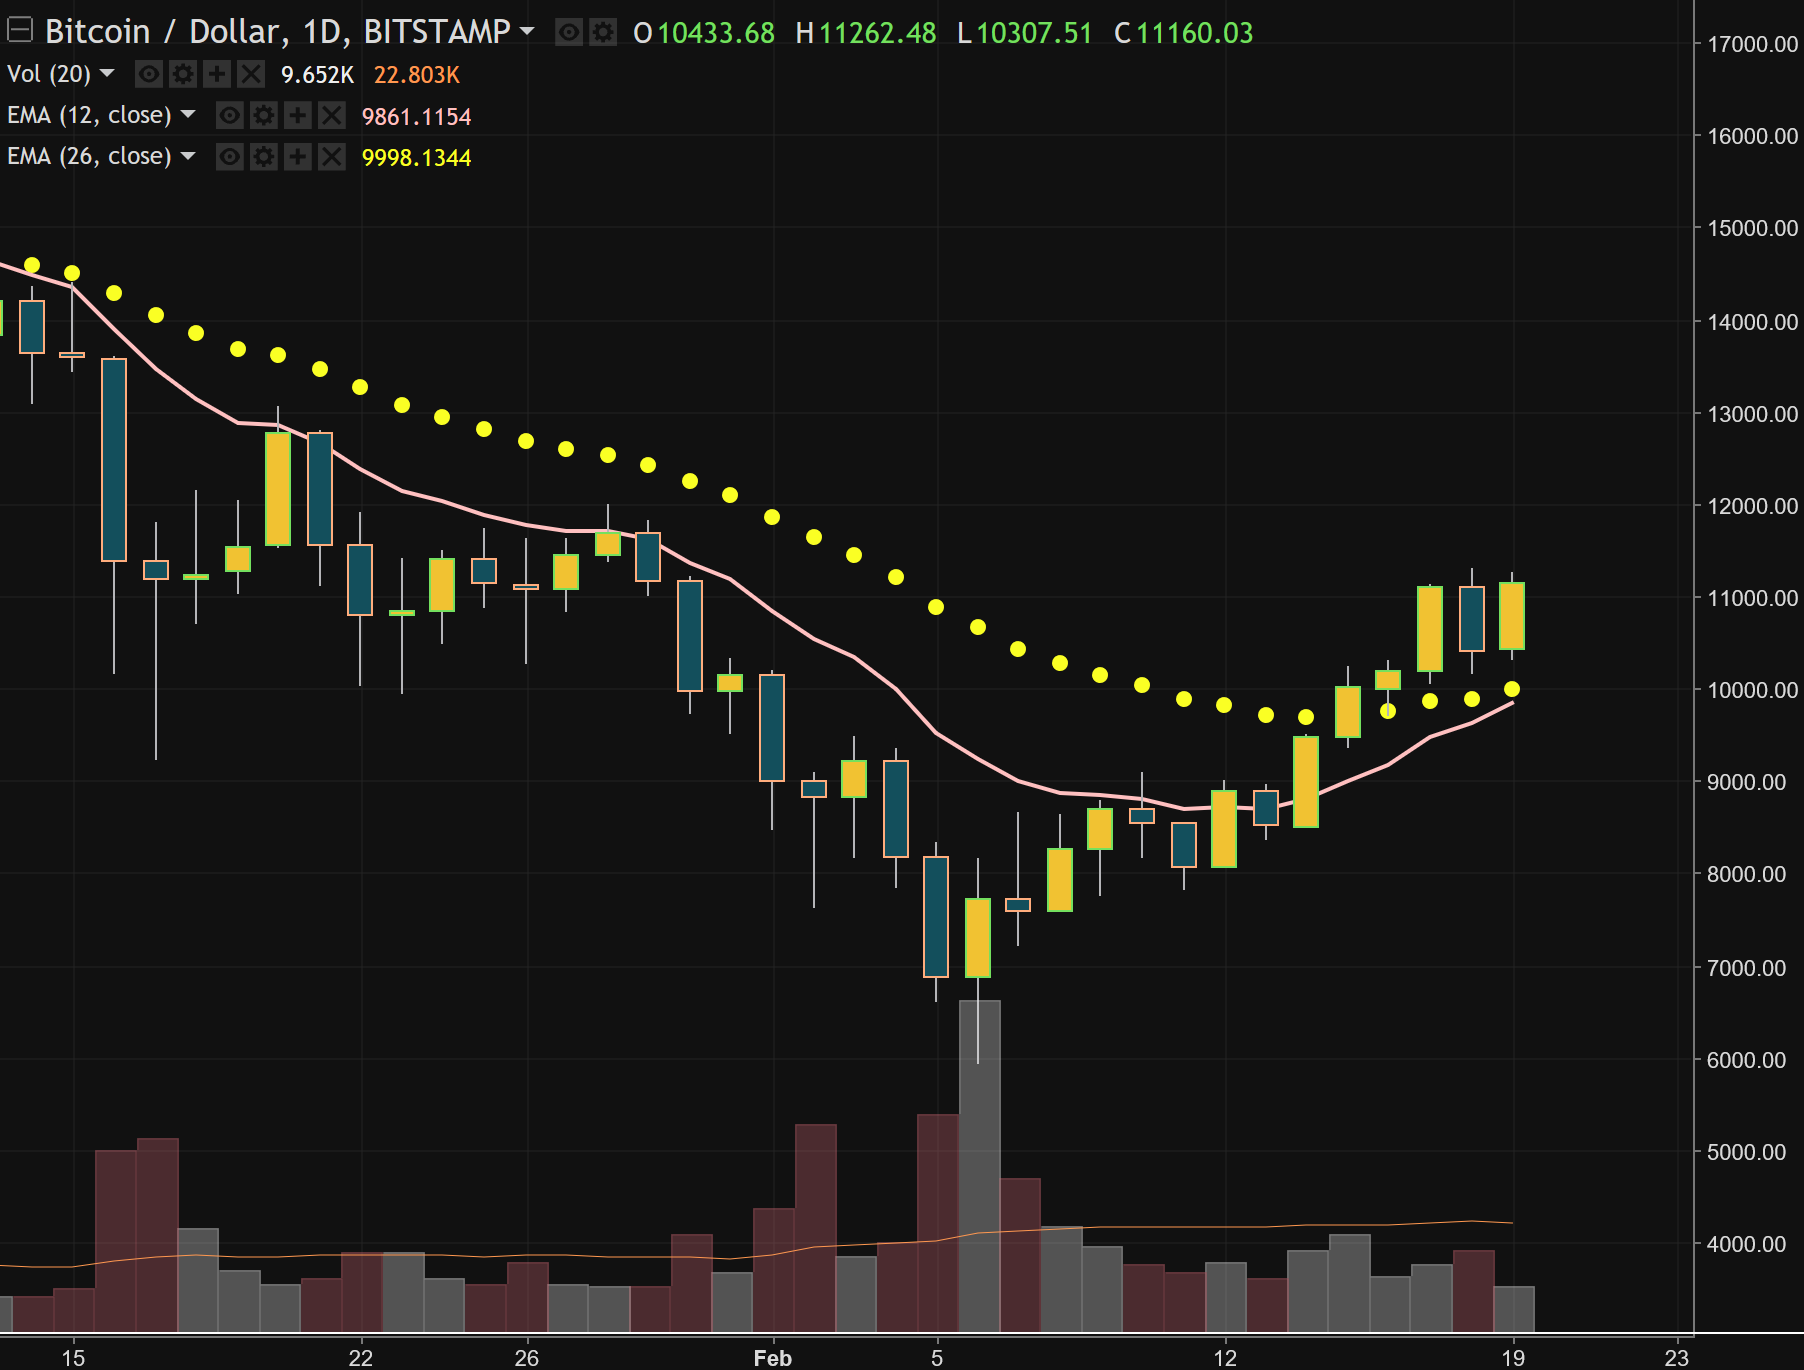
12 EMA: $9,860
26 SMA: $10,000
Over the next 24 hours, the daily chart could complete a bullish moving average crossover. This event would be extremely bullish for Bitcoin and portend continued higher prices. The last time BTCUSD's daily chart made this crossover was in late September 2017 and Bitcoin surged for 3 months until the 12 EMA crossed back under the 26 EMA in early January 2018.
Weekly Chart
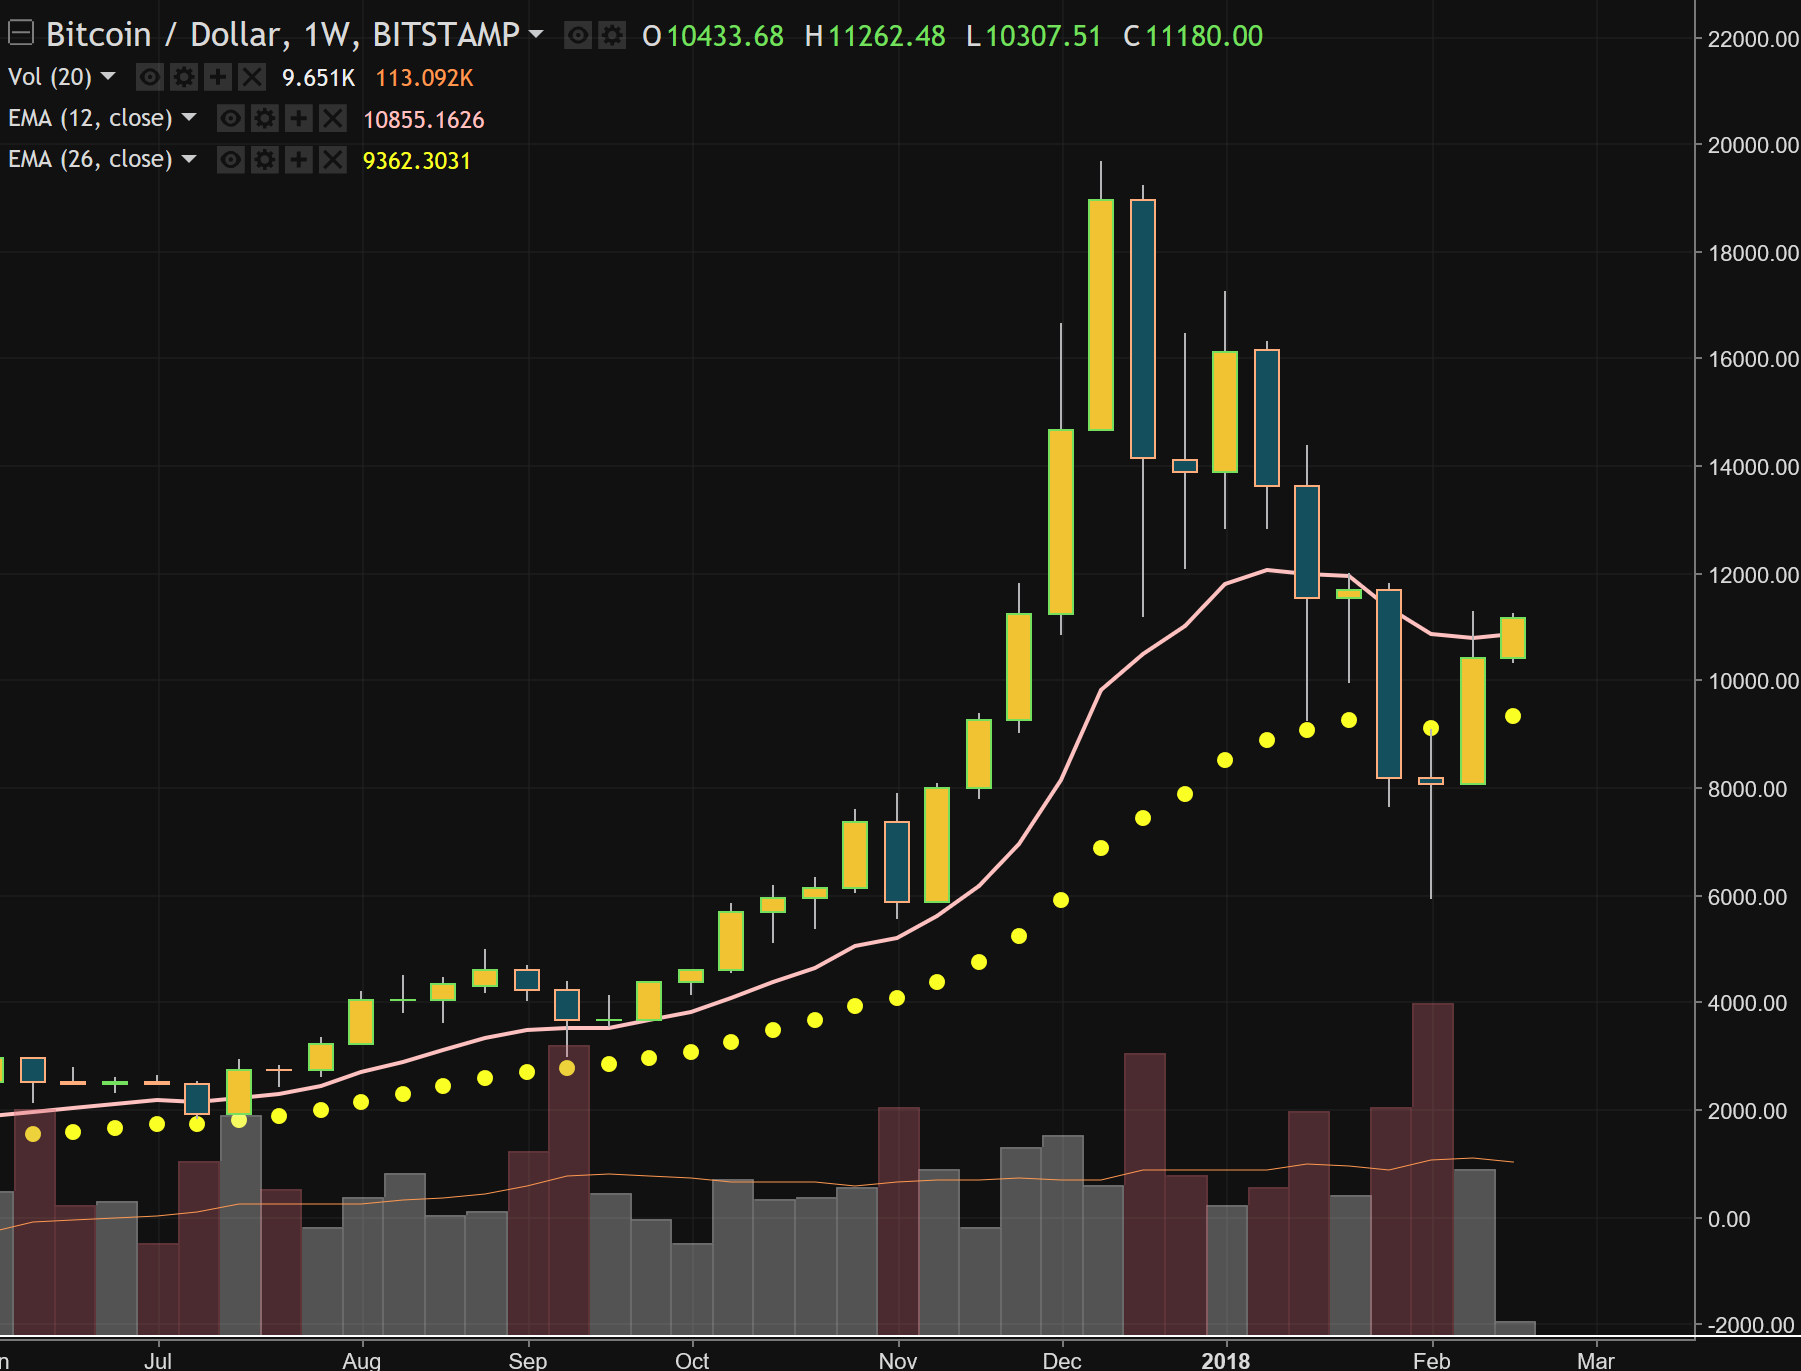
12 EMA: $10,855
26 SMA: $9,360
The weekly chart is still bullish, however the price needs to close this week above the 12 EMA for the bullish bias to remain intact.
DISCLAIMER
This post is for information and illustrative purposes only. It is not, and should not be regarded as “investment advice” or as a “recommendation” regarding a course of action.
SUPPORT
Bitcoin: 19498NLGwLbzN7yKrNbYqc4wuwZPkTGMVD
Ethereum: 0x76F2D78c81C6C97473DaF2aa3219F78Ce8C5A92f
Litecoin: LNhKXYTC5t2ZxcKYfo3pMzk8QsjZXsEbgT
CONTACT
twitter: sjanderson144
instagram: sjanderson144