Bitcoin Searching for Higher Low [Bitcoin Price Update 2/21/2018]

Bitcoin has pulled back from its two week high angle rally and is looking to find support. A bullish moving average crossover on the daily chart, if completed, should give BTCUSD fuel for a move higher.
4-Hour Chart
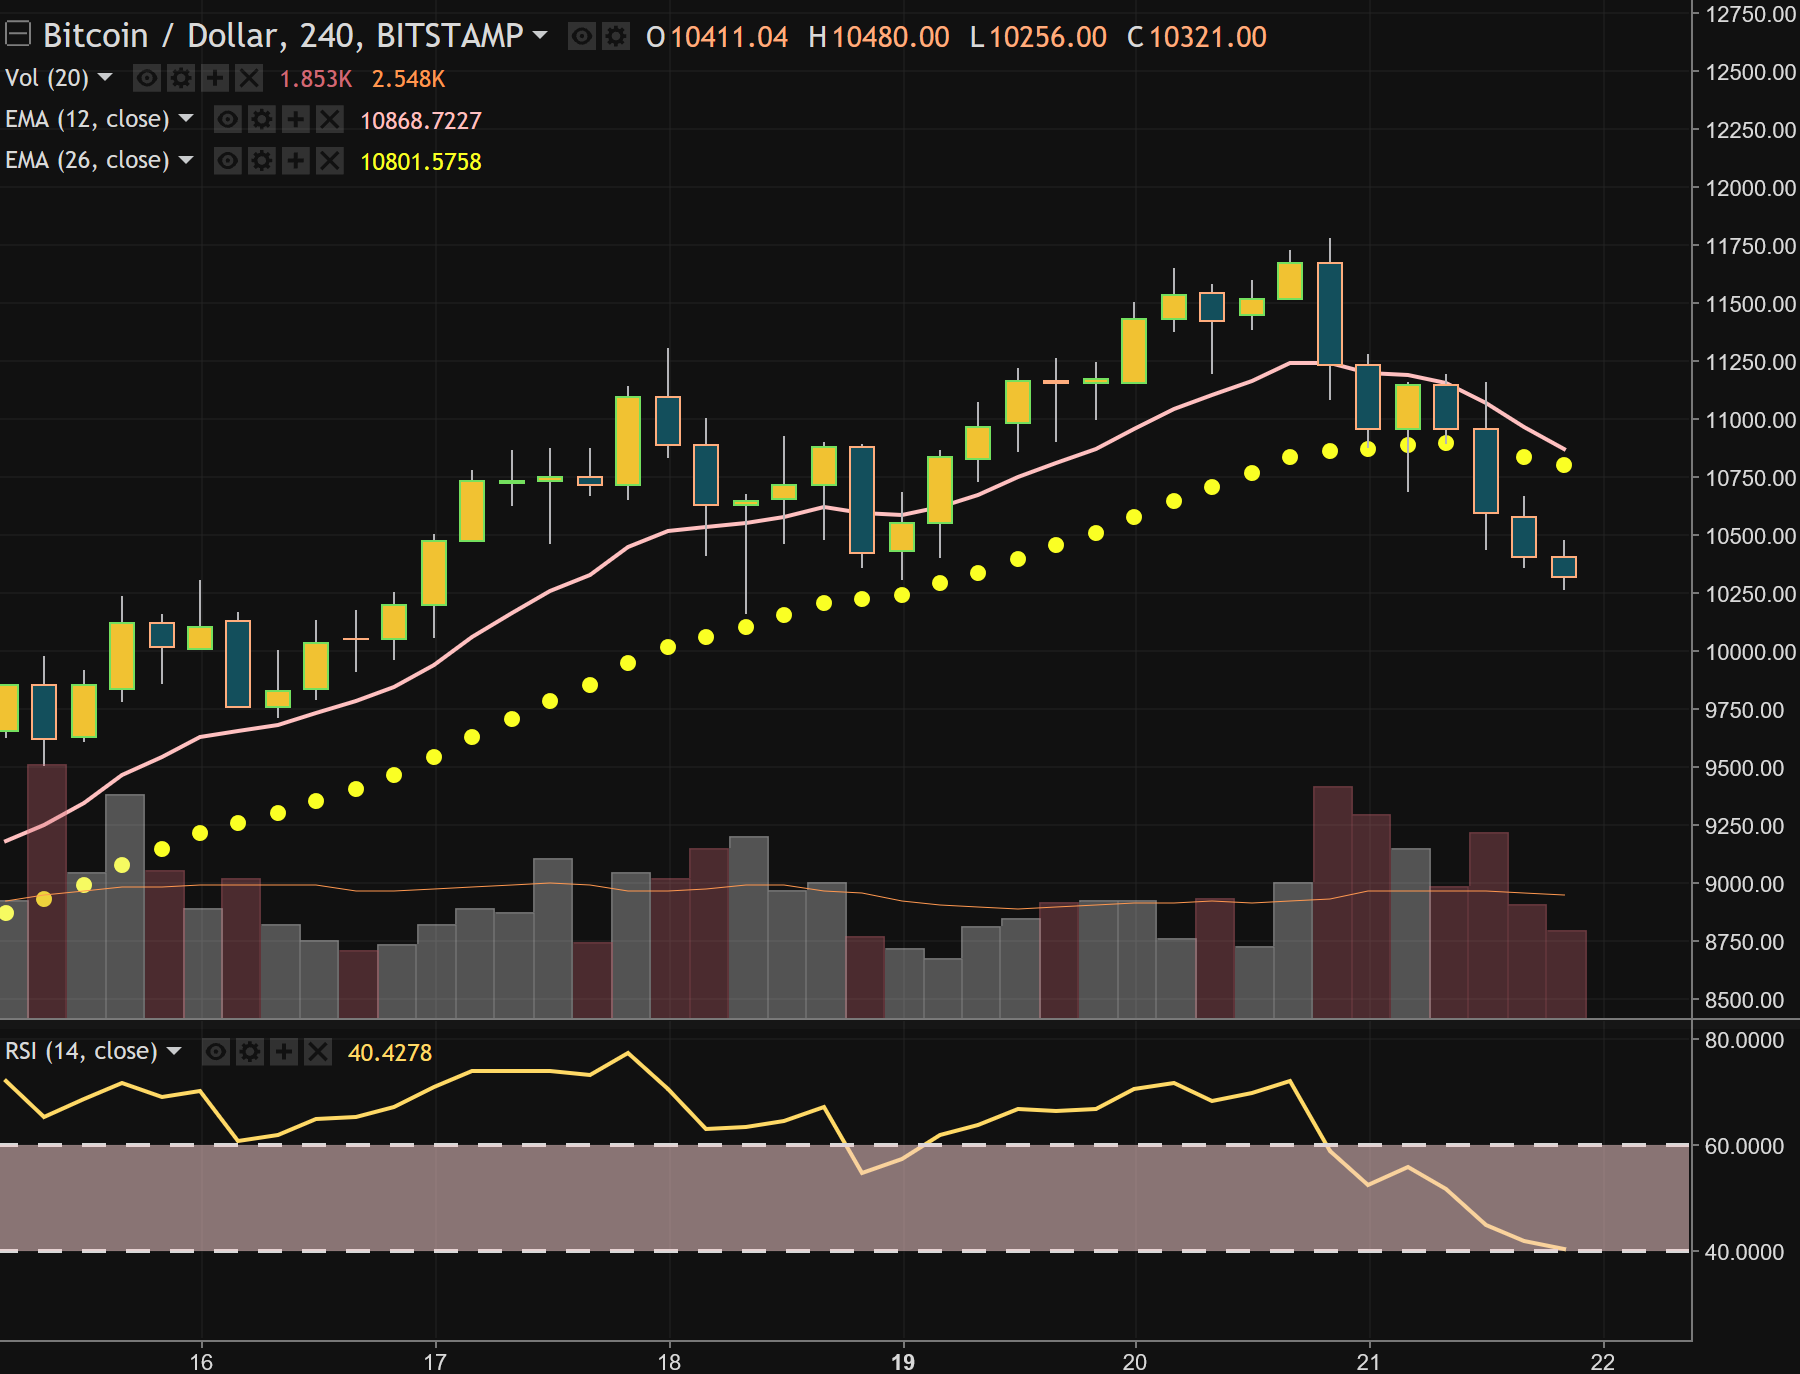
12 EMA: $10,870
26 SMA: $10,800
The 4-hour chart has turned bearish with the Bitcoin price closing below both its moving averages. However, the slow moving average is still valued above the fast, so the chart hasn't completely broken down yet. BTCUSD needs to overtake the $10,900 level for the move higher to resume.
Daily Chart
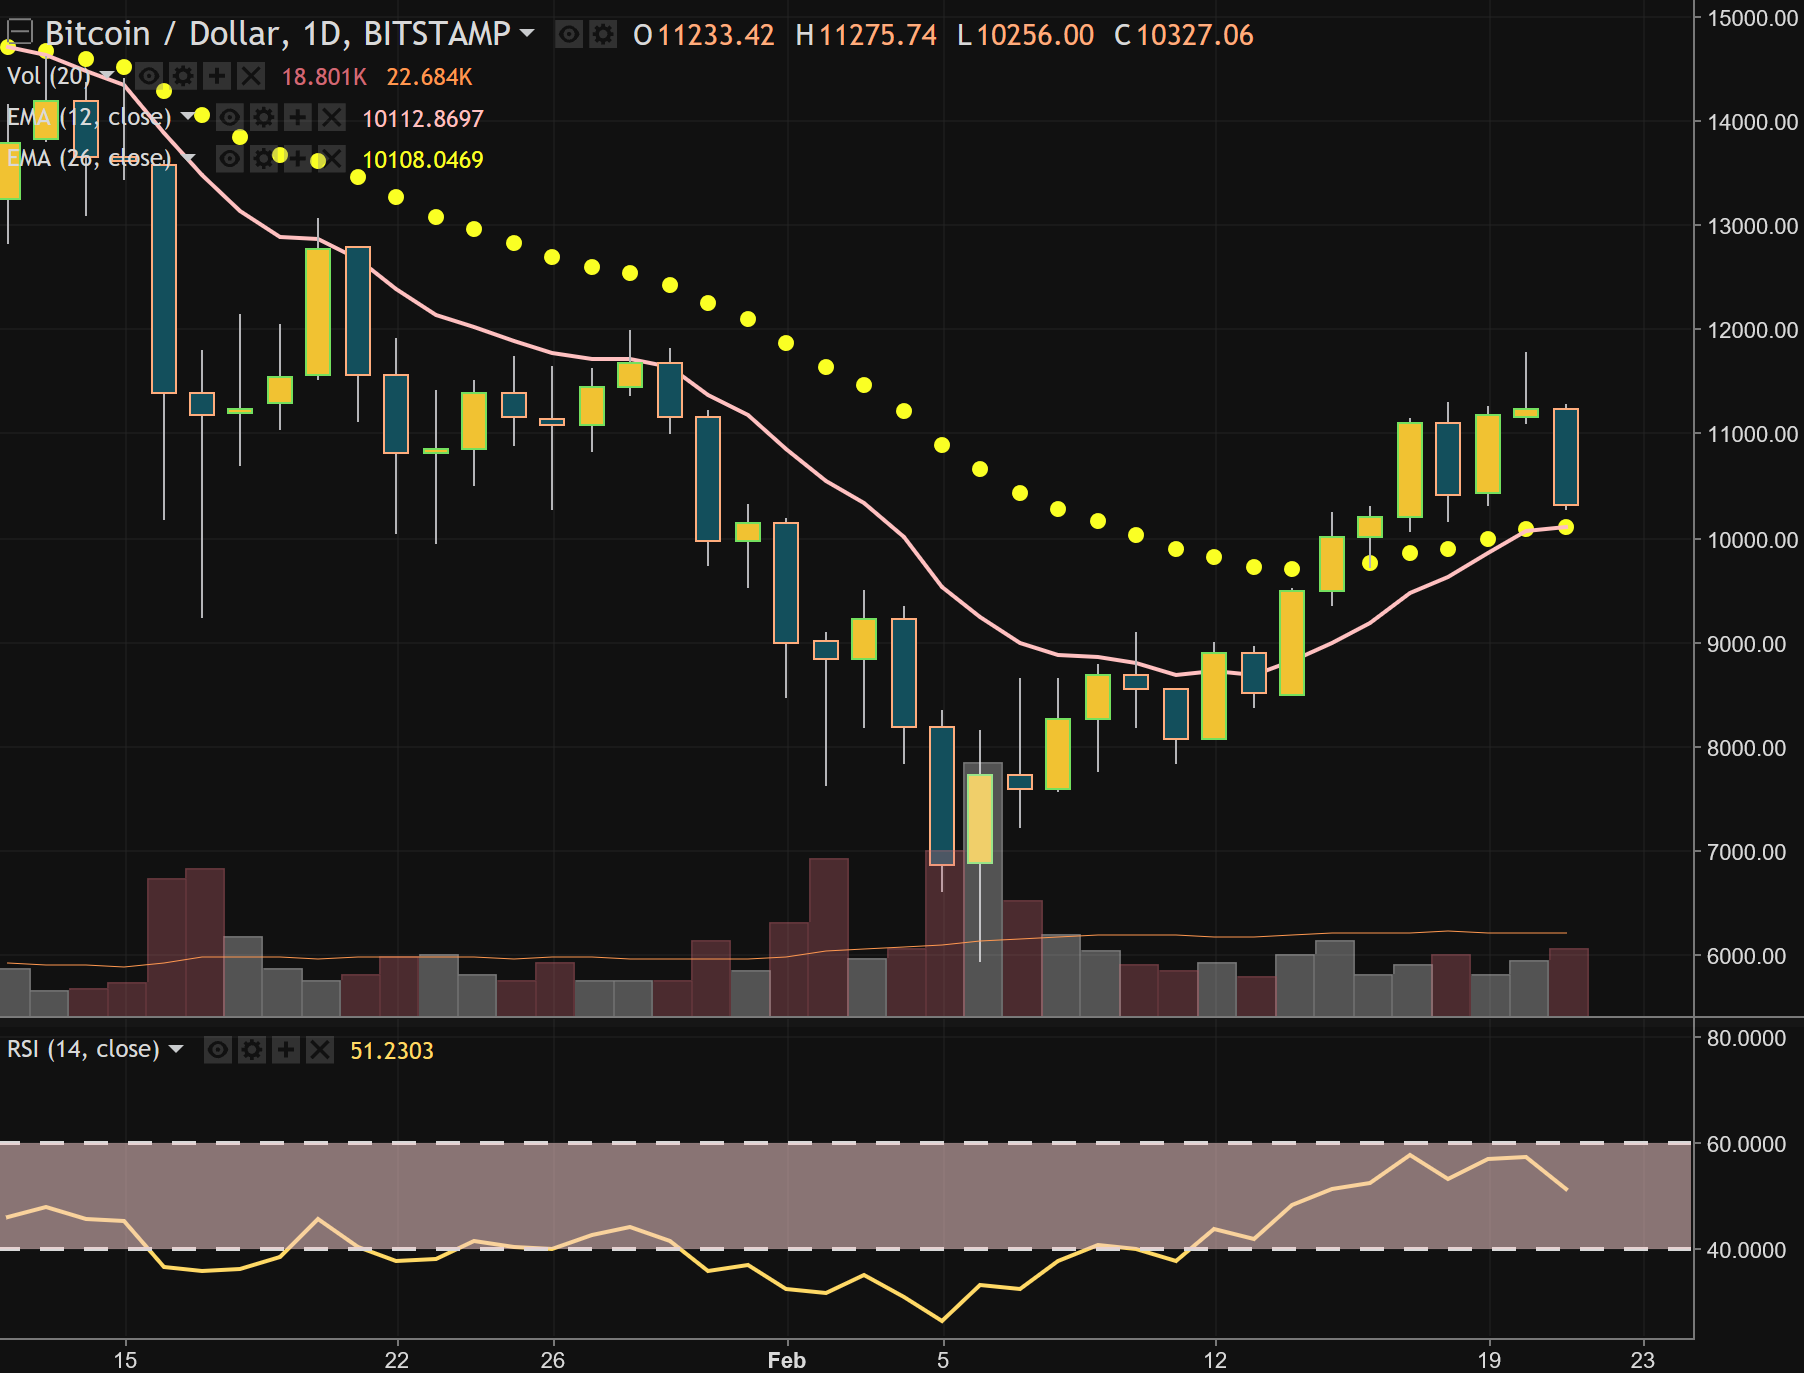
12 EMA: $10,115
26 SMA: @10,110
On the daily chart, Bitcoin is still bullish but has pulled back to test support at its rising moving averages. A close above $10,280 would cause the daily chart to complete its bullish moving average crossover. The last such crossover was in late September 2017, and the price surged soon thereafter. A sustained break below its daily moving averages could get ugly quick.
DISCLAIMER
This post is for information and illustrative purposes only. It is not, and should not be regarded as “investment advice” or as a “recommendation” regarding a course of action.
SUPPORT
Bitcoin: 19498NLGwLbzN7yKrNbYqc4wuwZPkTGMVD
Ethereum: 0x76F2D78c81C6C97473DaF2aa3219F78Ce8C5A92f
Litecoin: LNhKXYTC5t2ZxcKYfo3pMzk8QsjZXsEbgT
CONTACT
twitter: sjanderson144
instagram: sjanderson144