BITCOIN BUY ZONE ENTRY. And a quick lesson on proper H&S patterns.
Real quick.
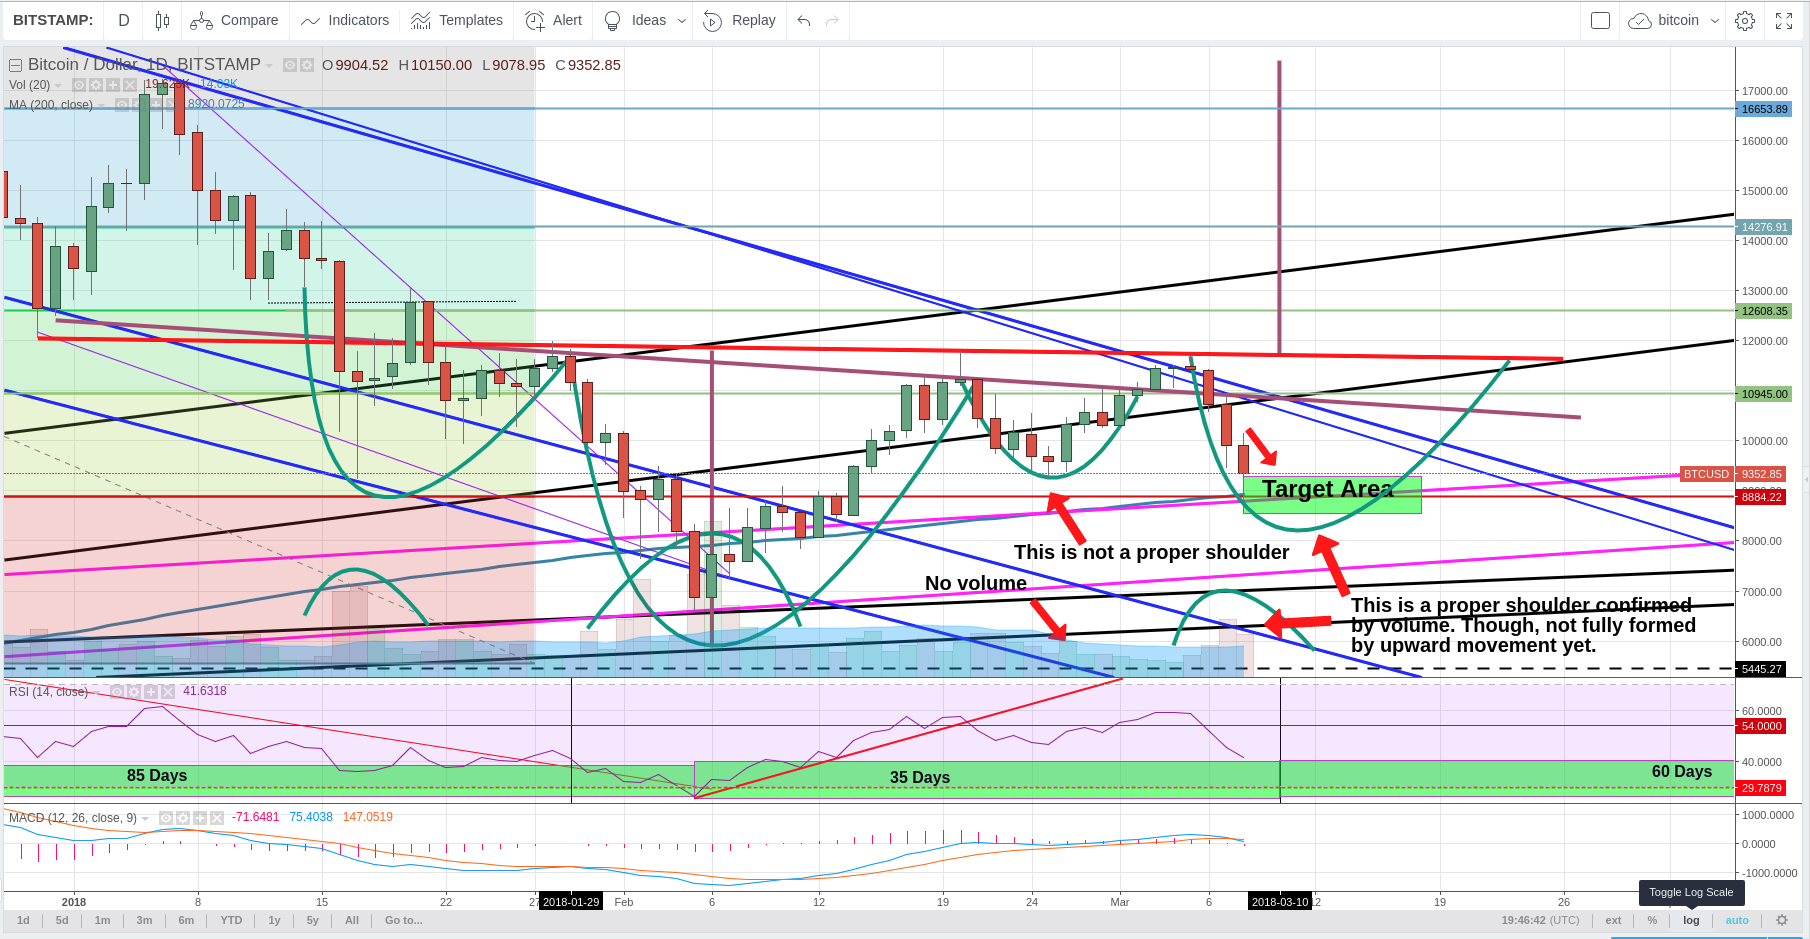
Here's is the inverse H&S pattern that the masses on TV were spotting.
The right shoulder that had formed (first one) looked good at the onset, but was not confirmed by volume. Thus, you will read in my last several posts, I was skeptical that it would give the bulls the strength needed to pass though massive overhead resistance. My skepticism has been confirmed over the past several days and I have been rewarded nicely for my sell at around 11k.
We have now entered into my projected buy zone where I have begun my buy back of BTC and have now re-positioned myself nicely for a bounce here off of the 200 day moving average.
You will see a second shoulder has begun to form. This is the correct shoulder. Although, not fully formed yet as we are missing the second half (our upwards movement), it IS confirmed by massive volume!
We can now project the upward price movement with greater certainty. Although, there still is MASSIVE overhead resistance, the bulls may have gained enough coiling tension with momentous downward movement (again confirmed by volume) and a predicted (at the time of this writing) bounce near the 200 day moving average, to propel us upward though our numerous overhead resistance ceilings.
A reanalysis will be made by me at the top of our BLUE descending channel and again at the second RED neckline.
If the bulls are able to gain enough momentum to break through our second neckline and final resistance point at around 11.7k, they should carry us northwards all the way past the 17k mark.
Again, reanalysis will be made and updated at important junctures along the way.
Happy trading friends.
Good analysis. Don't forget to include your disclaimer: "don't make trades based on my opinion..." etc...
I think it's healthy to see more sideways movement, gathering up of more energy is going to be needed to break through $11.8K - it's going to be teseted further, maybe several times before it does break upwards.
Do I have to make that disclaimer? sigh
Strongly disagree
This chart doesn't even show disagreement, let alone "strong disagreement". It's showing the same buy zone that I have already denoted?
Good job but why assume a violent impulse down in a low volume market is fallowed by a impulse up and not by a ABC , then one more impulse down ?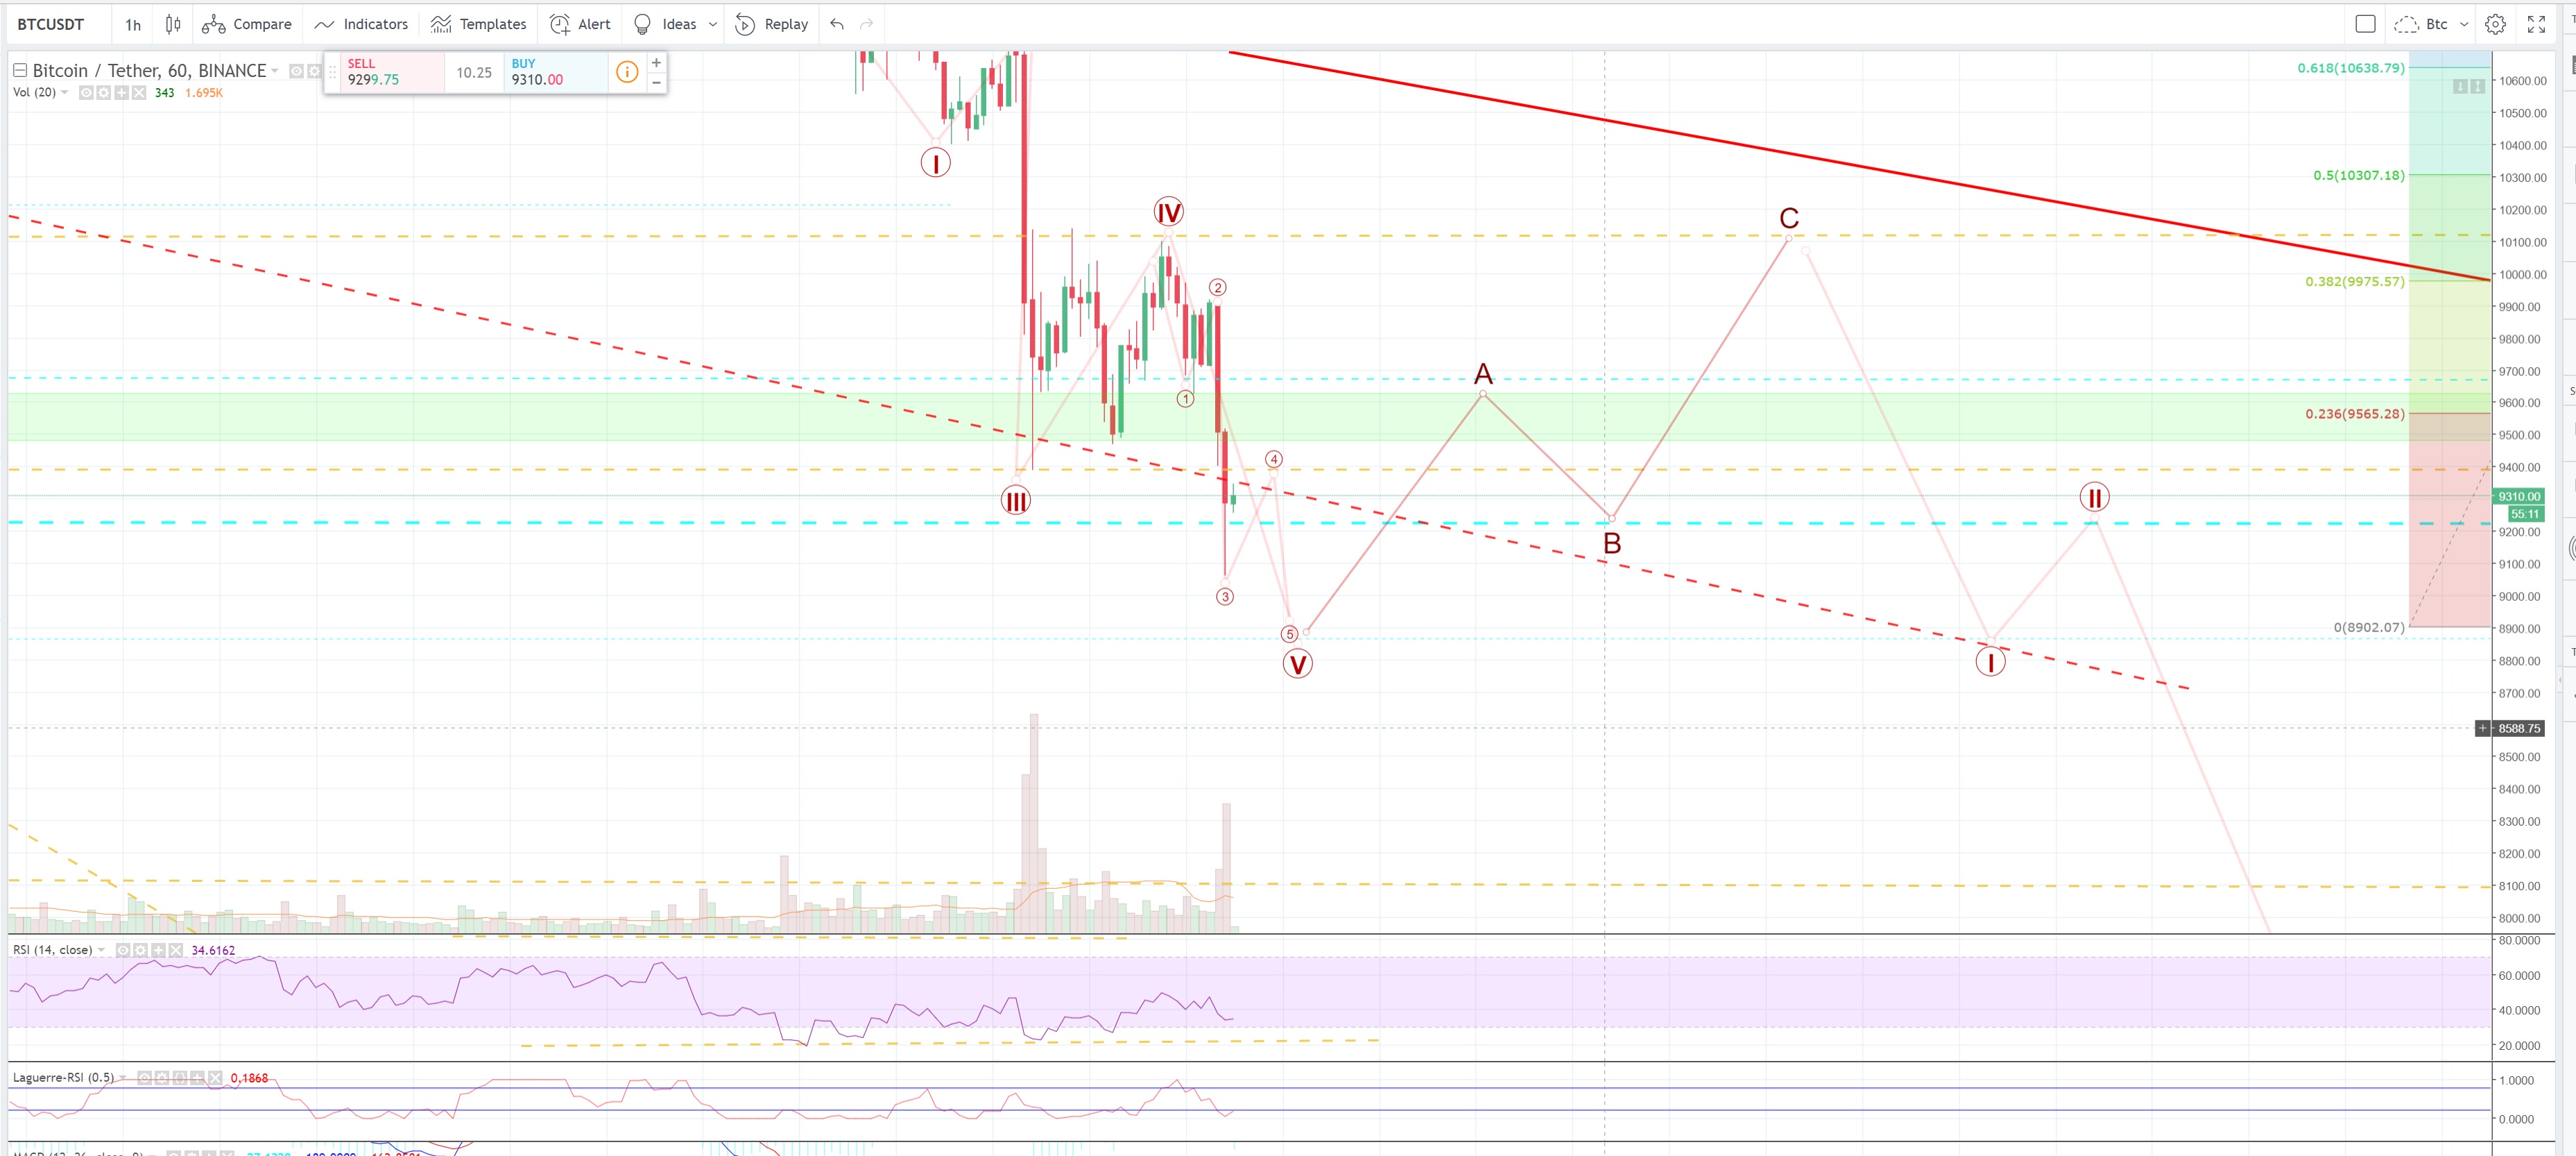
Could play out like that. Not saying it won't. I just don't have enough data from my charts yet. At this point the data is telling me the bulls will have the charge needed to continue upwards.
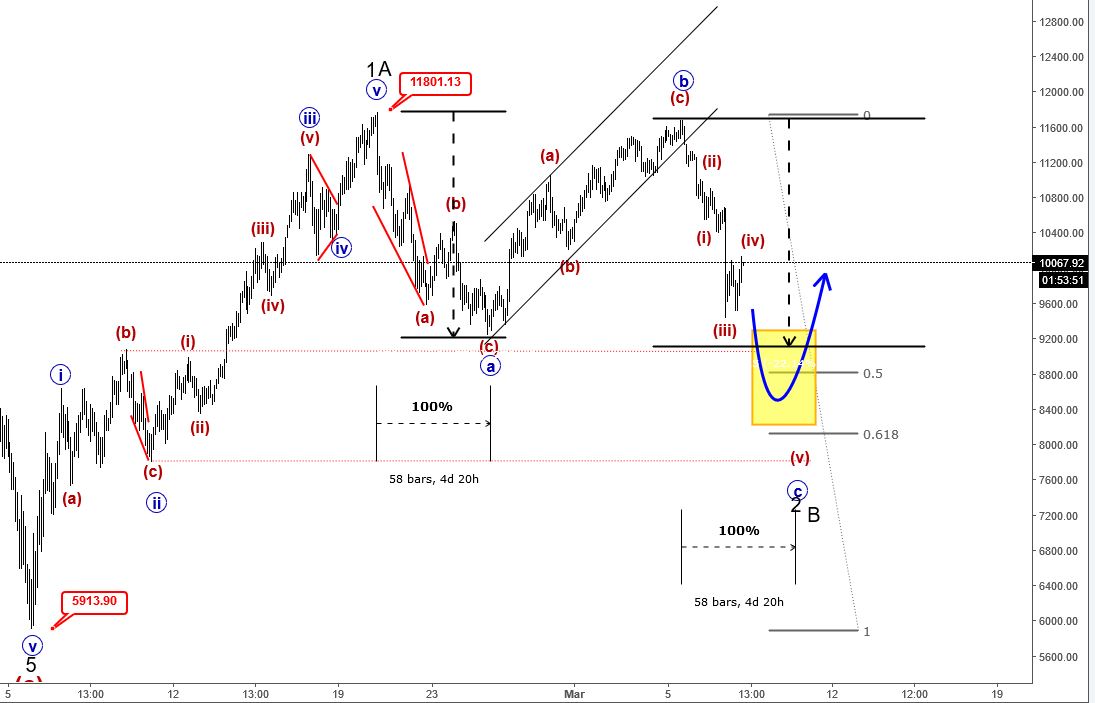
Here's my pretty chart from a few days ago. I have several other charts and possibilities prepared but this is my favorite.
and a study here: https://steemit.com/bitcoin/@biggranpa/bitcoin-btc-inverted-complex-head-and-shoulders-study
Thanks, I agree