Burned tokens, rewards, and inflation summary March 18, 2023: 138K SP, 93K STEEM, and 1,146 SBD burned in 43K burnsteem25 posts
Steemit launched the #burnsteem25 initiative on May 22, 2022 and the corresponding rewards started being delivered to @null on May 29. Subsequently, on August 9, Steemit announced that they'd be monitoring post promotions daily. Here is the next weekly update with PowerBI charts to visualize the burned token-related statistics since those dates.
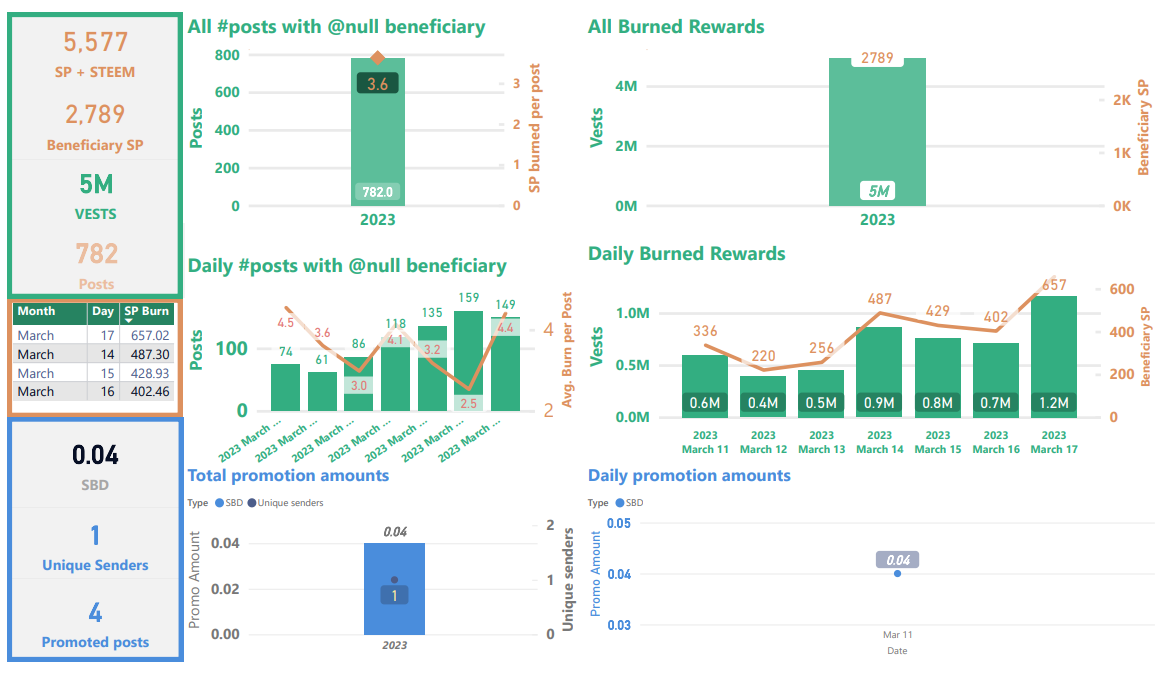
Slide 1 & 2: Burn amounts in beneficiary rewards and transfers to @null. (Weekly & All time)
According to data from steemdb, weekly totals were about 2,789 SP in burned beneficiary rewards and 0.04 SBD burned on promotion with 782 burnsteem25 posts (~3.6 SP burned per post). However, as - noted - previously - there is missing data from March 8 through March 14. I am thinking about retiring these graphs, as they are largely redundant with the graphs in slides 5-8, except that now they are also missing a week's worth of data.
The numbers in these slides will differ slightly from the numbers in slides 5 & 7 because of different data sources and collection times.
Weekly
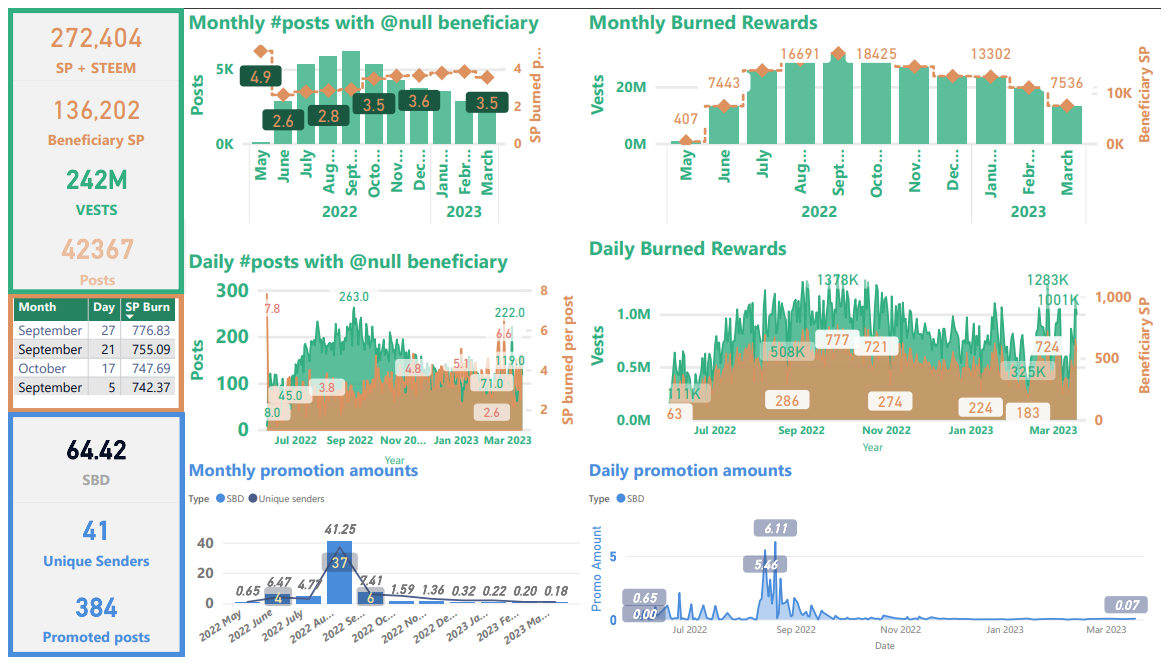
May 29, 2022 to present (burnsteem25 era)
| Sidebars |
|---|
Top sidebar summary cards show total number of STEEM, SP, and VESTS burned, as well as the total number of posts with @null beneficiary settings.
In the center-left sidebar is a new table showing the top-4 days in terms of burned beneficiary rewards.
Bottom-left sidebar summary cards show totals for SBD burned in post promotion.
| Graphs |
|---|
Top-left is a graph showing the number of posts and average SP burned per post by month.
Top-right: This shows the VESTS and the estimated SP beneficiary rewards burned per month.
Middle-left: This is a graph showing the number of posts and average SP burned per post, by day.
Middle-right: This shows the daily VESTS and the estimated SP beneficiary rewards that have been burned.
In all of the above graphs, VESTS are shown against the left axis, SP and STEEM are shown against the right.
Bottom: SBD transfers to @null. As readers are likely aware, SBD transfers to @null can get a post added to the /promoted page. The visualization on the left shows a monthly aggregation of SBDs transferred and a count of unique senders. The visualization on the right shows the daily record.
Slide 3: Rewards summary
Unchanged since August 21, 2022, SBD printing has remained paused. With the present SBD supply, it looks like the median on-chain price for STEEM needs to get back to about $0.252 for SBDs to start printing again. The burn ratio shows at 1.55%, which is up from 1.5% two weeks ago, but includes missing data from March 7 through March 14.
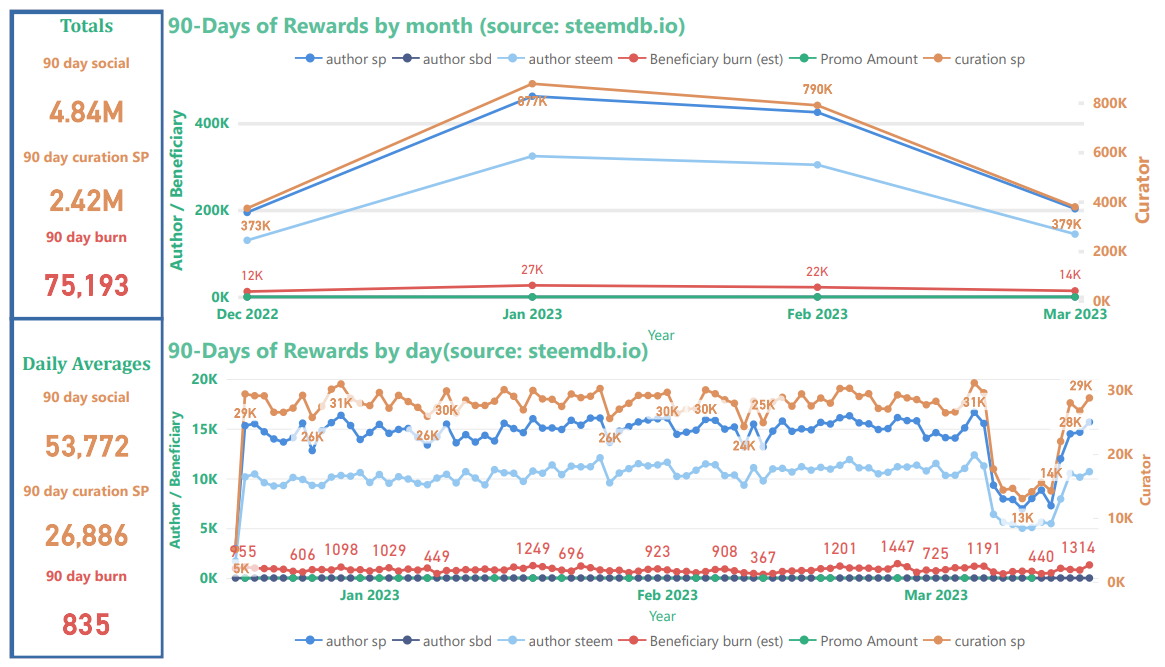
Curator rewards use the scale on the right, author and beneficiary rewards use the scale on the left. Thus, curation rewards appear to be scaled down relative to author & beneficiary rewards. Beneficiary rewards for @null in this chart (red) have been adjusted in order to account for both SP and liquid rewards. The top graph shows the monthly aggregations, and the bottom graph shows daily totals.
The new top-left sidebar shows estimates for the 90-day total of distributed "social rewards" (author, curator, and beneficiary), the 90-day total of curation rewards; and the 90-day total of burned beneficiary rewards.
The new bottom-left sidebar shows estimated daily 90-day averages for the same three values. In both sidebars, "social rewards" are calculated as [curation rewards] * 2. Based on these estimates, the burn rate is about 1.9% of all social rewards (this excludes interest paid for staking, rewards to witnesses, and SBDs to the SPS).
Slide 4: STEEM & SBD Supply as well as vested (i.e. staked or "powered up") STEEM
Noteworthy this week is that liquid STEEM as a percentage of current supply and of virtual supply decreased for the fourth straight week (top-right and bottom-left charts). Also, the current blockchain inflation rate is now running around 6.75%, which is down from 6.78% two weeks ago, and also down from 6.89% when I started tracking it on November 26, 2022. The value has ranged from 6.75% to 6.89% since I started tracking it. I'm not 100% sure, but I believe that these charts were not impacted by the missing data on steemdb.io.
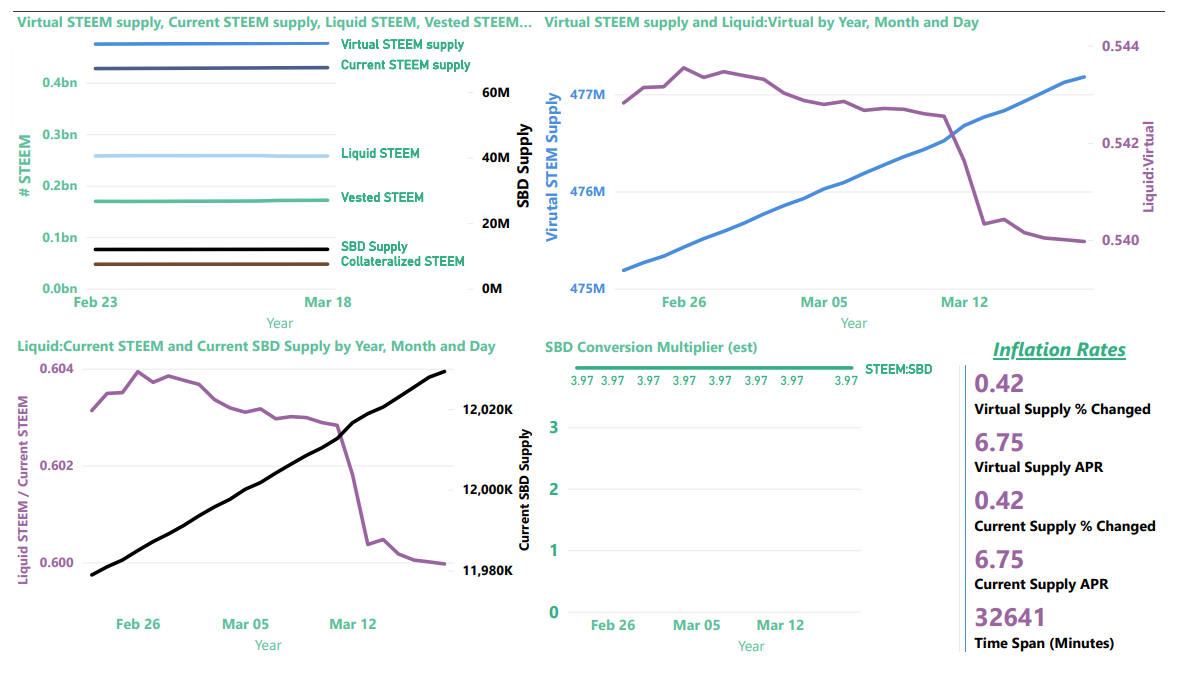
The card in the lower-right corner shows the inflation rates for current_supply and virtual_supply, as calculated from the SteemDB API.
The top-left image provides a summary view of current and virtual STEEM supply, current SBD supply, liquid and vested STEEM, and the amount of STEEM reserved as collateral for paying off SBDs.
| Note |
|---|
Collateralized STEEM and current SBD supply actually represent the same value expressed in terms of STEEM or SBDs, respectively. They're aligned differently on the graph because they use different axes. |
The top-right graphic now contains a zoom-in on "virtual STEEM Supply" (left axis) and the ratio of liquid STEEM / virutal STEEM supply (right axis). As we learned, here, virtual STEEM supply is heavily influenced by price, so with STEEM prices down, it's not surprising to find the virtual STEEM supply increasing. The up-side of this is that it's now possible to burn more collateralized STEEM per SBD with post promotion.
The bottom-left visualization now contains the ratio of liquid STEEM / current STEEM supply (left axis) and a zoom-in on Current SBD supply (right axis)
The chart on the bottom right shows the value of SBDs in terms of STEEM, according to the blockchain conversion rate, not external markets. This is the inverse of the blockchain's: internal price (which is different from the actual feed median, for reasons that I don't currently understand).
Now, here are some more details about each of the values
| Parameter | Axis (left/right) | Meaning | Comments |
|---|---|---|---|
| SBD Supply | right | Number of SBDs in circulation | Equivalent in value to collateralized STEEM |
| Collateralized STEEM | left | Number of STEEM needed to pay off all SBD debt | Equivalent in value to SBD Supply |
| Vested STEEM | left | Number of STEEM staked as STEEMPOWER | |
| Liquid STEEM | left | Number of STEEM that's not staked or needed for SBD collateral | Calculated as (Current STEEM supply - Vested STEEM) |
| Current STEEM supply | left | Number of STEEM in circulation | |
| Virtual STEEM supply | left | Number of STEEM in existence |
Slide 5-8
Instead of using steemdb.io, here are the newer visualizations - straight from the blockchain's API. These cover the last week, the last month, the full burnsteem25 era, and throughout the entire blockchain's lifetime.
New this week: The graphs are now showing STEEM, SBD, and VESTS, in addition to just SP. Also, I fixed a type error that was causing the SBD totals to be miscalculated.
Since these graphs come straight from the blockchain API, they should not be affected by the above-referenced problem with missing data.
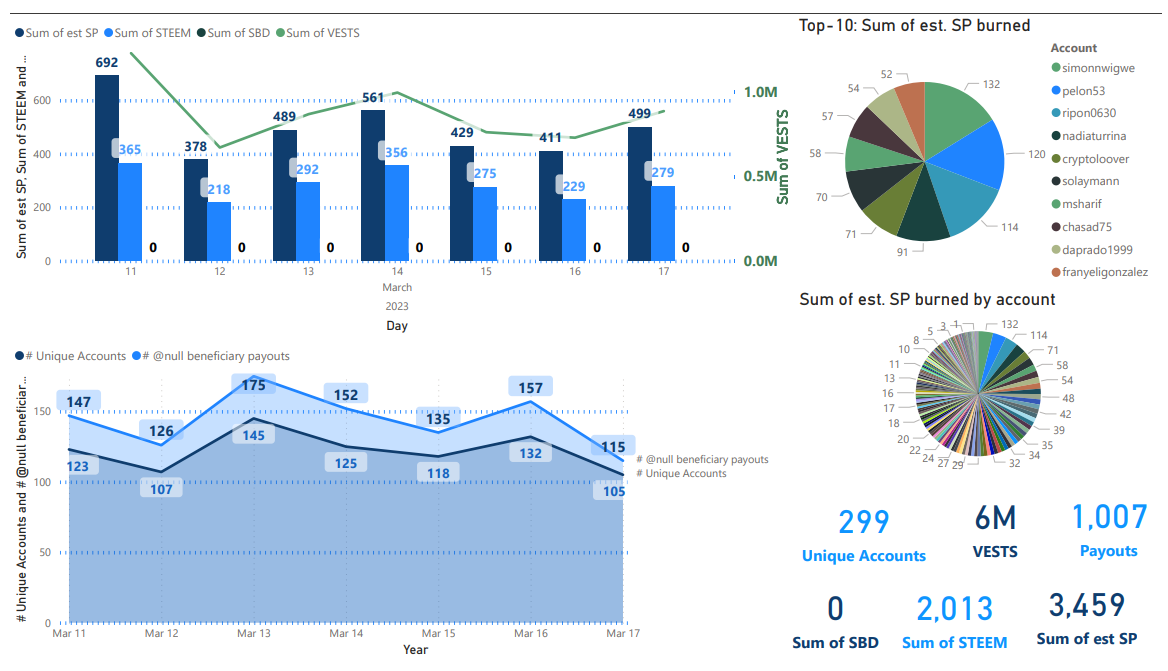
Last week
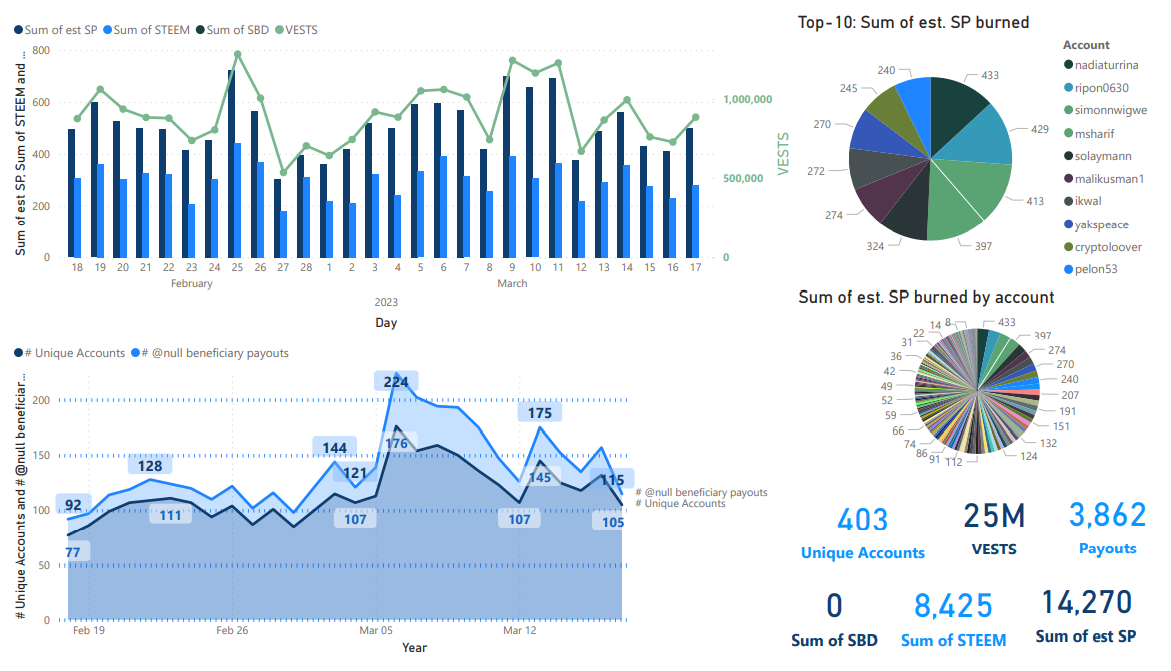
Last month
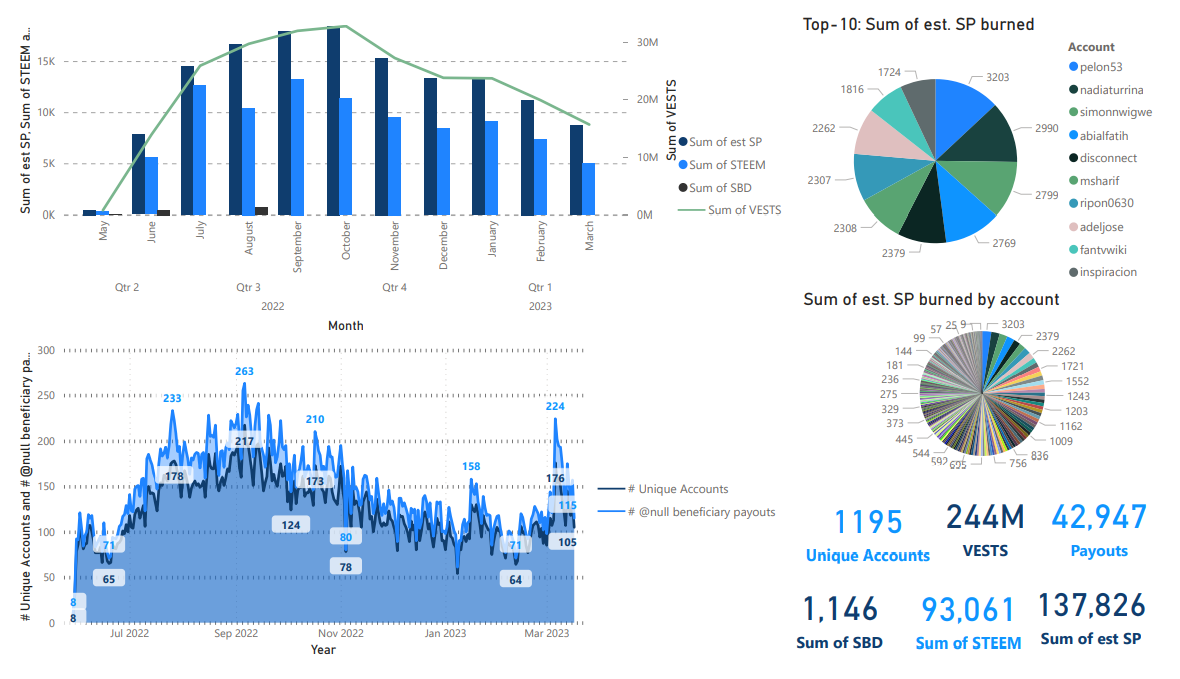
May 29 to present (The burnsteem25 era)
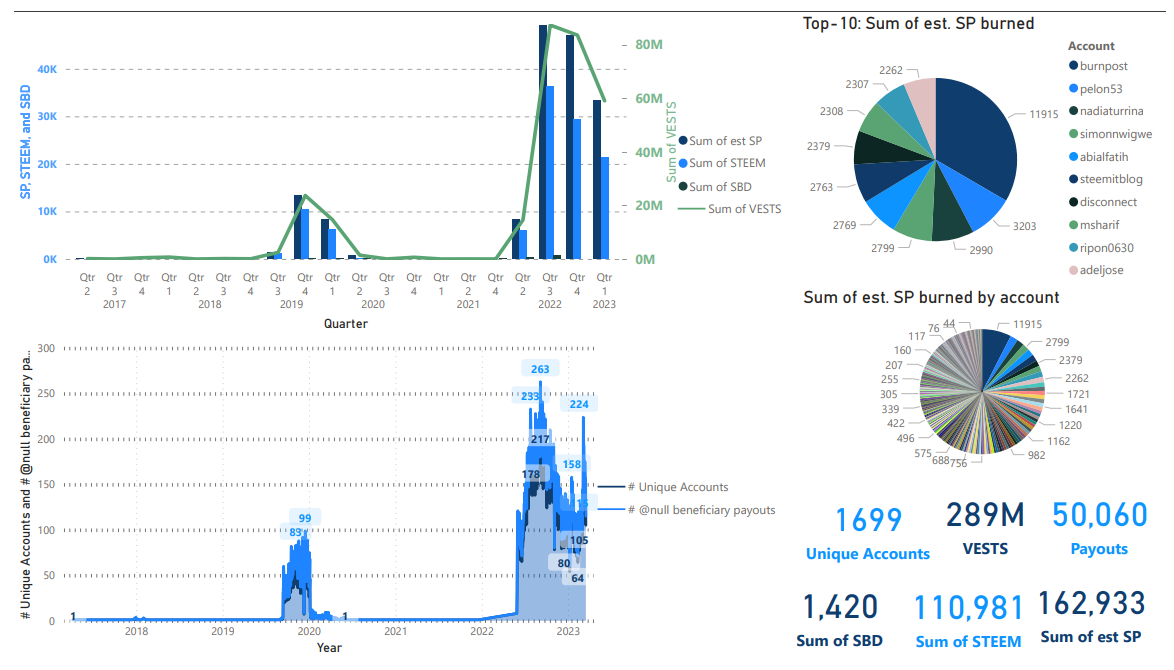
All time
In the last two weeks, @simonnwigwe and @abialfatih advanced from ranks 5 and 6 to ranks 4 and 5, pushing @steemitblog back from 4 to 6.
Thanks for reading!
Previous weeks
- Burned tokens, rewards, and inflation summary March 4, 2023: 131K SP, 88K STEEM, and 909 SBD burned in 41K burnsteem25 posts
- Burned tokens, rewards, and inflation summary February 25, 2023: 127K SP, 86K STEEM, and 909 SBD burned in 40K burnsteem25 posts
- Burned tokens, rewards, and inflation summary February 18, 2023: 124K SP, 84K STEEM, and 909 SBD burned in 39K burnsteem25 posts
- Burned tokens, rewards, and inflation summary February 11, 2023: 121K SP, 83K STEEM, and 909 SBD burned in 38K burnsteem25 posts
- Burned tokens, rewards, and inflation summary February 4, 2023: 119K SP, 81K STEEM, and 909 SBD burned in 38K burnsteem25 posts
- Burned tokens, rewards, and inflation summary January 28, 2023: 116K SP, 79K STEEM, and 909 SBD burned in 37K burnsteem25 posts
- Burned tokens, rewards, and inflation summary January 21, 2023: 113K SP, 77K STEEM, and 909K SBD burned in 36K burnsteem25 posts
- Burned tokens, rewards, and inflation summary January 14, 2023: 110K SP, 75K STEEM, and 909K SBD burned in 35K burnsteem25 posts
- Burned tokens, rewards, and inflation summary January 7, 2023 - Total burn estimates: 213K STEEM/SP and 64 SBD
For links to updates from 2022, see:

Pixabay license, source
Reminder
Visit the /promoted page and #burnsteem25 to support the inflation-fighters who are helping to enable decentralized regulation of Steem token supply growth.
Thank you for this wonderful update my friend.
If this means that the level of steem burn for the past week has reduced on my part then it is because of the lack of much support. You can check through all my active post and see that almost of them i set 25% to null but most of the post are not voted hence it is as though my rate for supporting burnsteem also reduced. So, in the past weeks, i have increased my support for the burnsteem initiative but there are not much support to enable me burn enough steem. Almost my active post has 25% beneficiary to null but only a few has a good support on it.
I love supporting the inflation fighters to ensure that the price of steem increases. I do hope more support will be given to help me burn more steem even as i post daily.
you @simonnwigwe are luckier than me, you still get significant votes, but now support for me is decreasing, but I'm still excited and determined to pursue ORCA's target at the end of 2023
Its not easy my friend but we will continue to push ahead. I hope we will be seen by the team based on our dedication in the burnsteem initiative and start getting significant support.
No, it wasn't intended as a criticism. It was just an observation that your account has burned more in total than all but 3 or 4 other accounts.
Okay. Its well clear my friend. I hope to continue supporting this initiative to help the price of steem appreciate in no distance time. #steem-on
Is printing of SBD depends on steem price? If so, is this manual or automatic process?
It's described here, here, and here. The short version is that if the market cap of SBDs reaches 0.09 * [STEEM's market cap], then SBD printing for posting rewards slows down. If the SBD market cap reaches 0.10 * [STEEM's market cap], then printing stops altogether. For SBDs to start printing again, the thresholds are the same, but in reverse.
Thanks for the analysis. For several weeks we could not reliably access the data. but now we will approach the data more reliably.
I wish you an excellent day