Daily Update S&P500
Last week I shared my analysis on the S&P index as well as hosted my first ever contest for my followers who made the closest guess to the closing price on the index for the week. The winner happened to be a new member to STEEM, h3xt0r who happened to win .25 SBD. I will continue the challenge this week and will keep the same format posting the challenge starting Wednesday and you will have until Friday morning before the market opening to put your guesses in. Once the market opens Friday I will not accept any new guesses. I will maintain the .25 SBD prize and hope to raise it soon so share the contest and the more people that join, the higher the prize will become.
Now let's get to the analysis of the S&P500. So last week we saw the S&P drop and then rebound very nicely. Today it dropped around 1%, something that we were expecting. Let's start with the charts.
The first chart I will show is the 4 hour view.
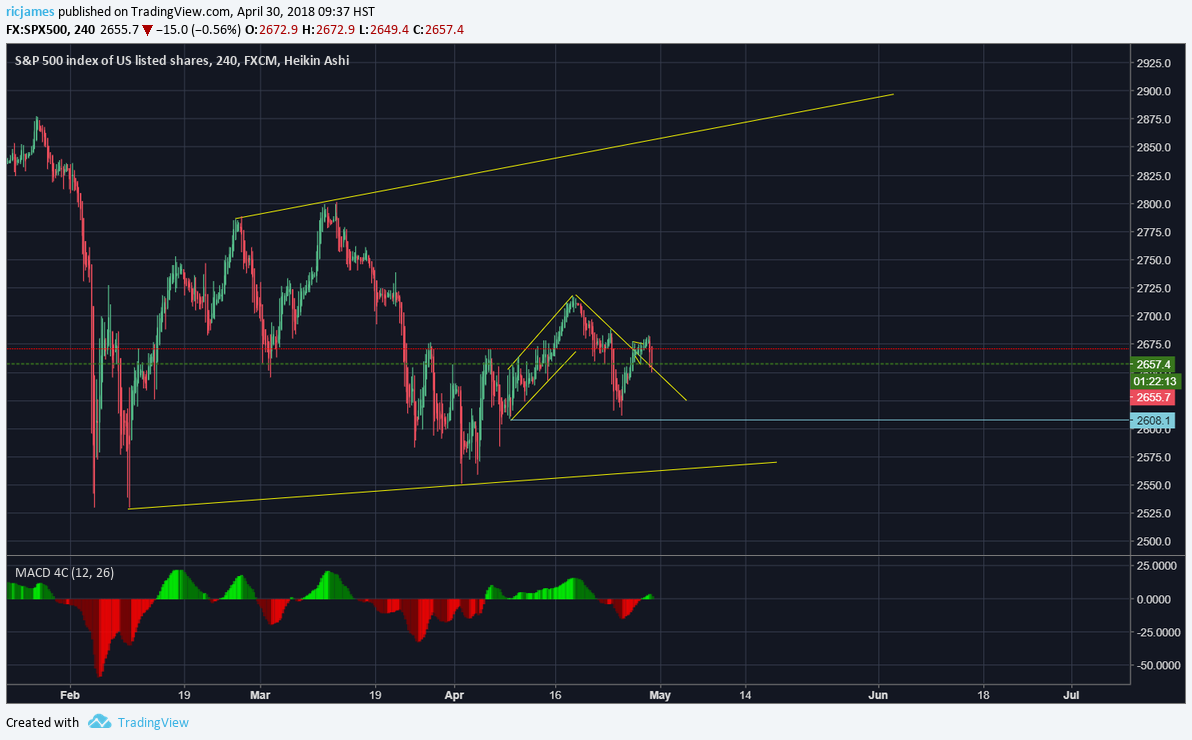
So here is the view of the whole pattern we have been trading within the last month or so. As you can see it is looking like it is trading within an expanding flat pattern. Now overall we are looking for upside on this chart within the next couple weeks to month where we should see the price come up to test the upper limits of the flat.
Taking a look at the 1 hour chart, you can see the current breakout and now drop in price. This drop is pretty severe and looks as though it is not a breakout of the trend-line. Because of this we are unsure of what this pattern might be so we need to wait for more of the pattern to resolve itself before we can determine where this will resolve to.
If the chart does something like this and we see a sideways correction followed by more drops but in a choppy pattern downward we should expect bigger upside and we would want to enter this trade to catch the upside.
However, if we draw this pattern as a flat we would expect more downside where it might actually test the lower support line of the bigger expanding flat. Both of these are very possible outcomes and it is better to wait to enter the trade until we have a better picture of the chart.
I will continue to update you guys on when we might see a possible entry point on this chart for a long position so keep a lookout for my post. If you guys liked the contest let me know how I might make it better and if you would like to see anything else. I am thinking of adding a Bitcoin and or Steem contest as well but will continue with the S&P for now. I hope you liked my analysis and if you want to see another stock or crypto leave it in the comments below and I will see about posting an analysis of it.


Awesome post!! Keep it up and check out THIS POST as well as I have something similar.