Bond Break?
There are two things I turned bullish on when the year began: gold and bonds. Both of these are based on long-term patterns. Short-term, of course, I watch them quite closely anyway.
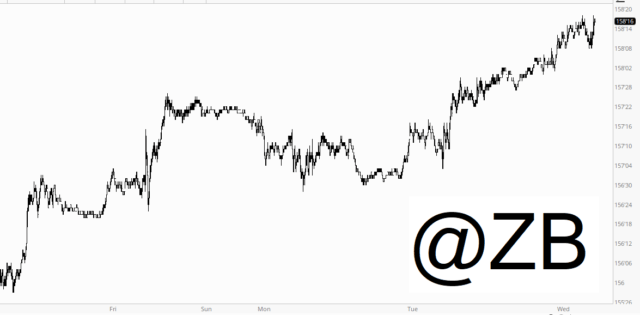
Bonds, by way of the /ZB futures, have been slowly (very slowly!) strengthening in recent days.
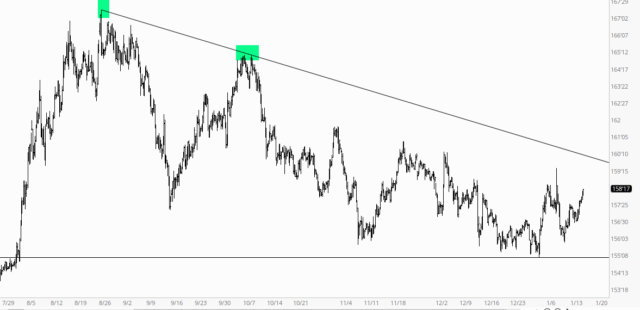
Longer-term, there is a massive right triangle pattern that has been in formation since last July. If prices can manage to break above the descending trendline, my view is that spells big things for the market in general (and of course very good things for all these TLT calls I own). We aren’t there yet, but there’s a chance.
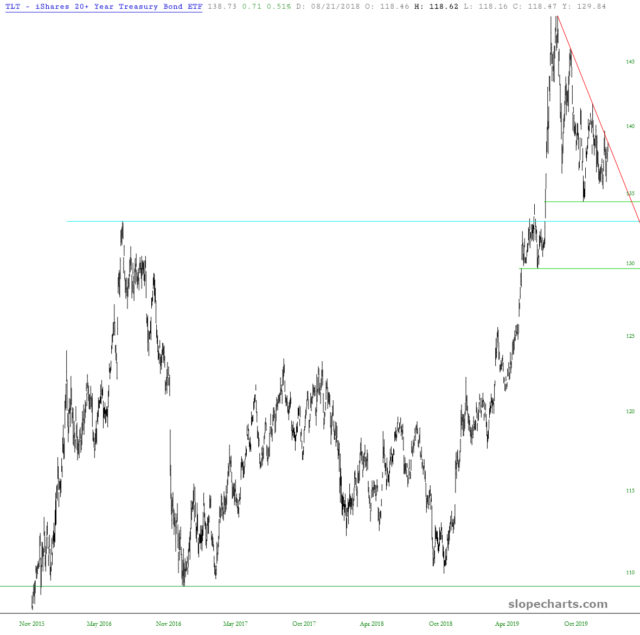
The above two charts are ZB futures, but below we have the ETF symbol TLT, which is basically the same thing. You can see the same pattern on the right side, and you can observe how the much larger pattern is very bullish, assuming that we do indeed ultimately break above the aforementioned trendline.