Bitcoin’s Sharp Reality Check: What the 12-Month Chart Is Really Saying
Bitcoin’s Sharp Reality Check: What the 12-Month Chart Is Really Saying
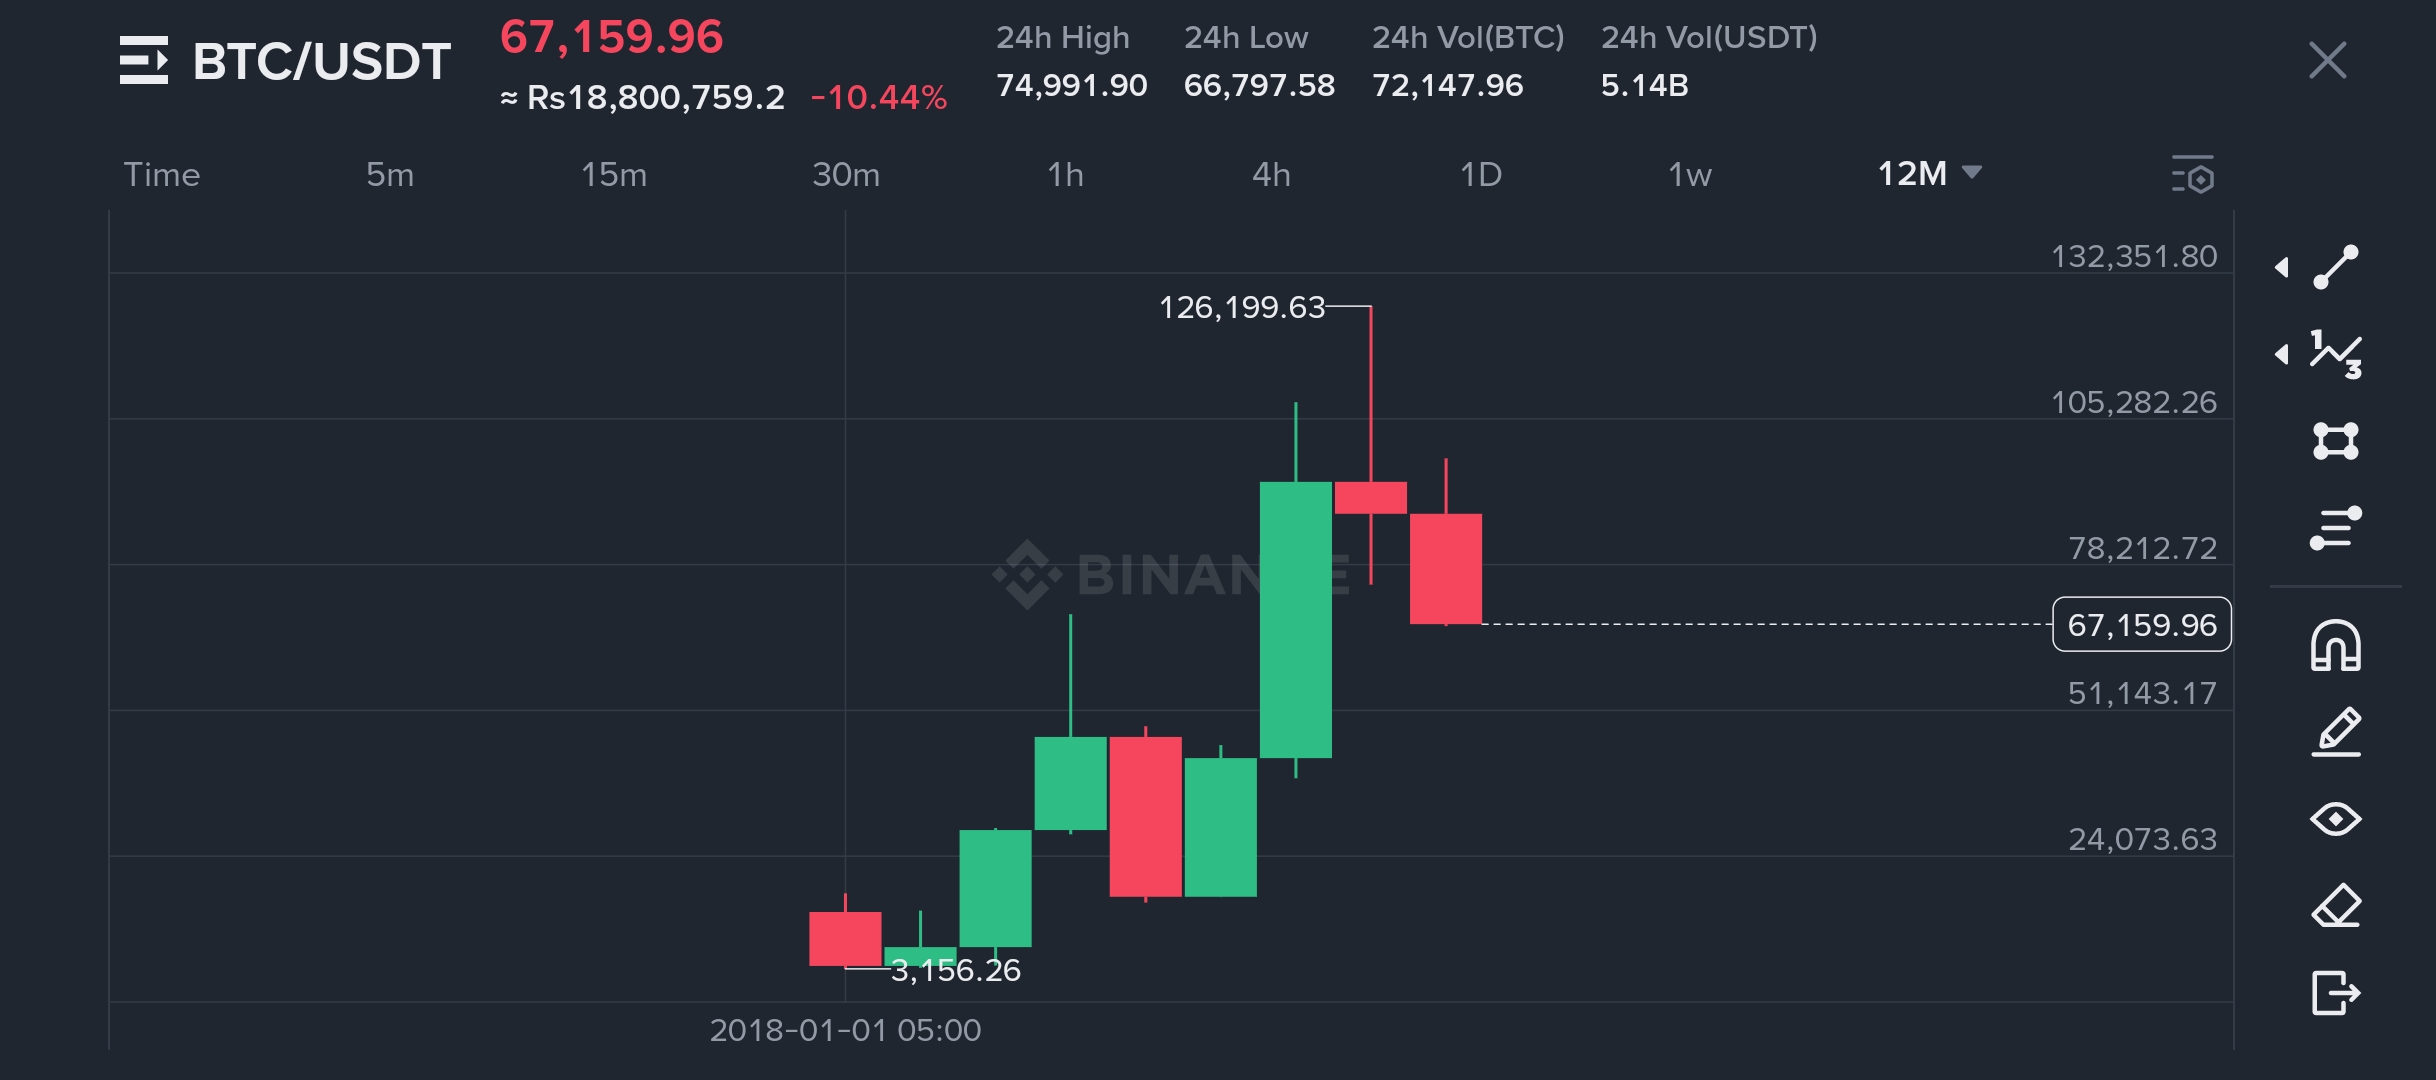
At first glance, the BTC/USDT chart over the last 12 months looks like a story of extremes — massive hope at the top, followed by a harsh reminder of how unforgiving the crypto market can be.
Bitcoin is currently trading around $67,159, marking a 10.44% decline on the day. Just hours earlier, price attempted to hold higher ground near the 24-hour high of $74,991, but selling pressure quickly took control. The drop wasn’t slow or gentle — it was decisive.
From Euphoria to Exhaustion
The most striking detail on the chart is the long journey from Bitcoin’s explosive rise toward $126,199. That candle tells a clear story: aggressive buying, strong momentum, and a market convinced that higher prices were inevitable. But markets don’t move on belief alone.
Right after that peak, the structure changes. Large red candles appear, showing heavy profit-taking. The rejection from the top wasn’t subtle — it was sharp. This is usually what happens when late buyers enter after a long rally, while smart money quietly exits.
Volatility Is Back in Control
With a 24-hour low at $66,797, Bitcoin has shown how quickly sentiment can flip. The volume confirms it too: over 5.14 billion USDT traded in a single day. This isn’t low-interest selling — this is active participation, panic from some traders and opportunity hunting from others.
The chart doesn’t show weakness alone; it shows indecision. Buyers are still present, but they’re no longer chasing price blindly. Sellers, on the other hand, are defending higher levels aggressively.
The Bigger Picture
Despite the current pullback, it’s important to zoom out mentally. Bitcoin is still far above its earlier base near $3,156, a reminder of how far the asset has come. Corrections like this are not abnormal after strong rallies — they’re often necessary.
What matters now is behavior around the $65k–$67k zone. If price stabilizes here, it could turn into a new support. If it breaks, deeper retracements shouldn’t surprise anyone.
Final Thought
This chart isn’t screaming “bull” or “bear” — it’s warning traders to stay disciplined. Bitcoin is no longer in a one-way move. Every candle now carries consequence.
In moments like these, patience matters more than prediction. Markets don’t reward emotion — they reward timing.