BTC update 23.01.18 - pointing out the worst case
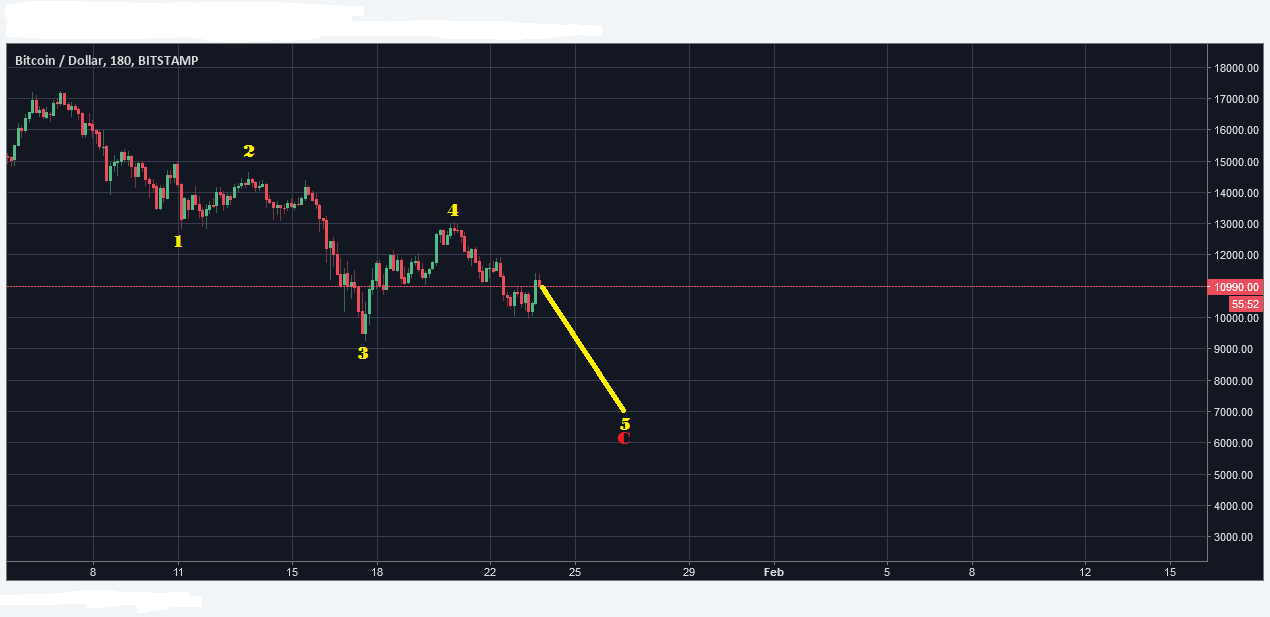
Yellow wave 5 of C could have started now. If so, this is the worst case that I would expect for this wave:
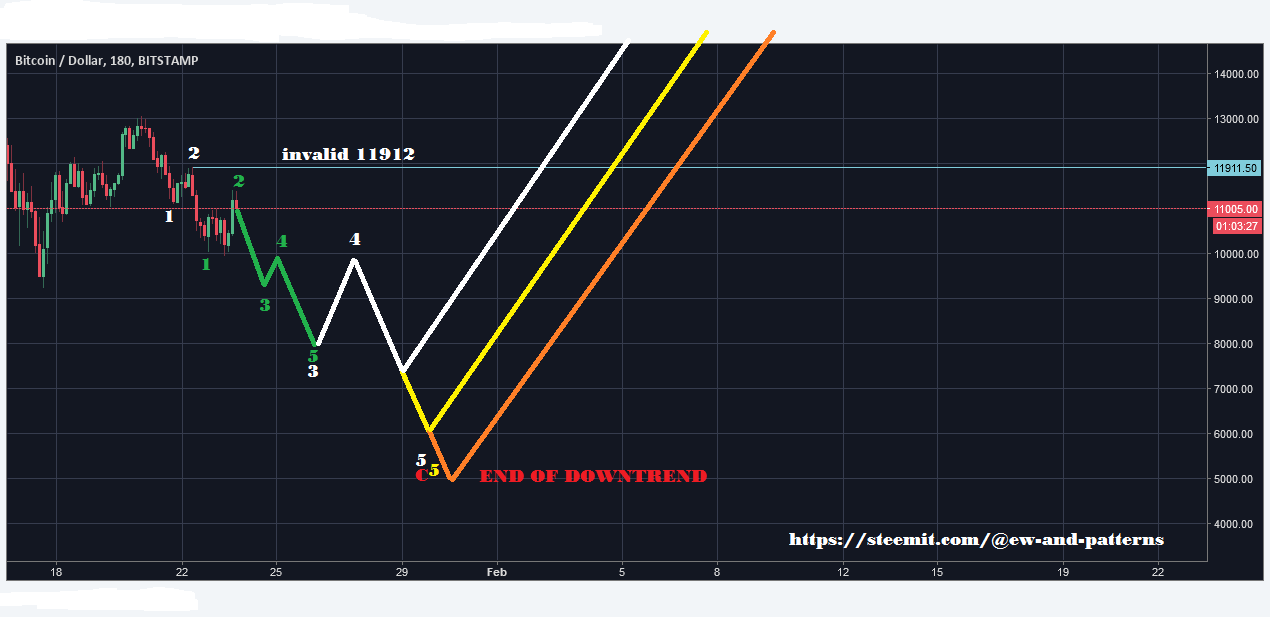
The form an fit would be just perfect.
Come on dear sellers, let's get this over with, so cryptos can finally start to show their real potential for 2018.
Stay tuned...
.png)
If you think this to be useful information:

Feel free to use and share my charts, but please mention me, @ew-and-patterns as the author. Otherwise it is considered plagiarism and I will flag you and advise my friends to do the same.
MUST READ!
DISCLAIMER: This post / analysis serves general information purposes only. I am not, and never will be a financial adviser. The material in this post does not constitute any trading advice whatsoever. This is just the way I see the charts and what my trading ideas (from my personal experiences) are. I use chart pattern and Elliott Wave analysis for my trading ideas.
For full disclosure: The author of this post is holding positions in this market at the time of this post. Please conduct your own due diligence, if you plan to copy anyones investment decisions!
If you make any trades or investments after reading this post, it is completely in your own responsibility. I am not responsible for any of your losses. By reading this post you acknowledge and accept to never hold me accountable for any of your losses.
Please consider leaving a comment, like or resteem, if this post entertained you or helped you see things differently...
Have a nice day :-)
Thanks again for the tradingview link @ew-and-patterns. In case folks are not aware, Elliott Wave Theory is a study of the fractal behavior of price fluctuations amidst at least 5 various degrees of trend.
Okay, so I just couldn’t resist going to the tradingview site to check it out. As any new charting platform appears to a brand-new user, it most certainly felt quite cumbersome in contrast to my TradeStation platform.
Aside from all of that, within an hour or so after signing up, I rendered this long-term Wave-Count for BTC using monthly price bars. Mind you, this is a very quick study, and rather off the cuff – so I hope that you will take it for what it may be worth.
What my quick interpretation reveals using ALL of the available price data provided, are prospects for a large first-wave, perhaps one of “Cycle-Degree” (largest blue “1” wave) to either still be in progress – or having ended already with the recent all-time highs, which I currently have labeled on this chart as a (3) wave (the smallest blue mark-ups).
I am showing this larger FIRST-WAVE up, subdividing into five impulsive primary waves labeled with the large red numerals. With such a view, the primary 3-wave (red) is subdivided into five waves at intermediate degree labeled in the smaller blue markers as intermediate degree waves (1), (2), (3), (4), and (5). As such, the primary wave 3 lasted roughly 2-years, roughly between 2012 and 2014.
As my count stands here, the primary degree 4th wave decline lasted nearly 2-years as well. It was a sideways affair with a downside bias, as most 4th waves tend to be. This primary 4th wave down ended in the $200 vicinity.
Thereafter, taking us right up to the present, I am showing a powerful extended 5th wave at primary degree (red), subdividing in the five smaller intermediate waves noted.
Insofar as this rather quick study goes, from the recent all-time-high in the 20k vicinity, we may currently be in the midst of an intermediate (4) wave decline (small blue labels), which would then suggest one last push higher is needed to complete the primary degree 5th wave of the yet larger Cycle-Degree 1 wave. Once the current (4) wave decline is complete, this count is EXTREMELY BULLISH over the near-to-intermediate term.
Alternately, and more bearishly, the recent all-time-high may well have marked the end of the large blue first wave up at Cycle Dimension, suggesting that a larger Cycle-Degree wave 2 down may already be underway.
Holding to the tenets that 2nd waves typically decline to the area of the 4th wave at one lesser degree, would suggest that a wave 2 decline at Cycle Dimension, may fall as low as the $200 handle. I’ve outlined such a prospective price path forward into the future using a rough A, B, C, zig-zag decline pattern, which could take many years to unfold – perhaps out as far as 2024.
Well, you asked for it @ew-and-patterns, and there you have it. I do hope that my quick study for a longer term EW look at BTC was up to snuff and that your audience gathered some benefit and insight from it as well. All the best mate, Cheers!
To the top! Just awesome how fast you were able to use all functions of this platform!
I usually don't like logscale because in my experience it distorts the waves and implies equal percentage growth for the future.
This is close to what haejin came up with.
Without logscale it looks like the correction will be done soon, but with it, the chart says that this year BTC will not be able to rise at all. And if this cycle degree wave 1 is already in, it will not rise until 2024 when 200$ was hit? LOL
Or is this a misinterpretation of your chart?
4,356 might be a good target then, but the trendline will likely not be hit again in this correction.
Can you please do an analysis with a linear chart?
Thanks so much again. You should take this entire letter and make a post on your blog out of it.
Thank you, brother! Ha! I too shy away from log scale at all cost (my gold chart below is in arithmetic scale, as I typically prefer.)
The reason I choose log-scale, in this case, is that there is simply not enough historical data to get a good feel for the wave structures. My Gold chart actually goes back to 1975, which provides more than enough historical data to garnish an accurate birds-eye-view in the standard "arithmetic" scale.
I'll pull up a linear chart again to take a second look - but no promises on rendering another interpretation.
Don't know who "@haejin" is, but yeah, I think you've pretty much interpreted my quick count accurately.
I'm a "music-man" now, so I really don't want to paint my blog with technical analysis. Perhaps if I had a second account, I might consider focusing on such - but right now, I am just super busy with the #openmic, and the #openmicsongwriters projects. I truly don't know that I could even find the proper amount of time to give such an endeavor - even if I had a dedicated account handle to do so.
Thanks for the suggestion though, and the link to the charting site - I really appreciate that, brother!
The most important thing is to be posting about what makes you happy. If it's music to you, so be it. But please consider giving my blog a visit from time to time to drop another gem comment like your previous ones.
I am still very interested to see your interpretation of an arithmetic 4 hours/daily chart of BTC :D
Thanks, man! I'm following you... I don't get to my feed as much as I ought to, but when I do, I'll be looking for you. :-)
Here's how I see it: the $10k support held well yesterday, and I think we'll see $12k by the end of the week. If this band holds as support over the next 24h, the chances of a run to $12k increase substantially.
The movement looks threewave-ish, so I doubt that. But if you are right, 12000 will be breached tomorrow, which would mean that the downtrend is already over now. I am turning extremely bullish over 12k.
I TOTALLY AGREE JUST GET THE LOWER LOW ALREADY SO WE CAN START TRADING AGAIN. !!!! We all know this is the Futures marke on wall street pushing price around! But we need there $$$$ to go higher so..... We also know this crypto 2018 is moon time so $9k,$8k,$7k,$6k,$5k....just pick one and we will grin and bear it (pun intended) before the UPTREND RESUMES! G LOVE CRYPTO!! also all the newbies needed to be welcomed to the party with a violent selloff to test their resolve!!!!! IMHO
exactly! What a warm welcome for the newbies, shrinking their portfolios by 60% as a welcoming gift. Nice!
LOL WELCOME TO BITCOIN 🤷♂️🚀🤷♂️🚀🤷♂️🚀
Let’s just hope that the cartel of perpetual corruption a.k.a “the entrenched world-wide financial system of ill repute,” and their CME futures brethren at Goldman Sachs and the NY-Fed trading desks, - don’t have anywhere near the level success in suppressing the price of crypto’s like they have with keeping a tight lid and cap on the intrinsic value of Gold and Silver.
Peace, Love, and Justice for All
Gold and silver is just fine! The evil dollar must go! as a tool for oppressing the entire world.
You got that right, brother!
Just take those banksters dollar away and many conflicts and wars indirectly sponsored by them will go away too. Those suffering people will be very grateful to us Crypters to bust this banksters with free crypto money away!
To which of the five "degrees of classic EW trend" do you refer amid your prognosticated wave count?
What is the timeframe of those bars? Intra-day, Daily, Weekly, Monthly???
I'm asking as an ardent EWT practitioner for more than 20-years... just curious is all...
In addition, are you using Fibonacci projections or "wave equality" tenets, to arrive at your "worst case" downside targets??
The timeframe is visible in the chart, it's a 3hours chart.
I am talking about a biggest wave degree wave 1 (19,800) and 2 (7,524 , 62% retrace) here (no idea how this is called correctly in english). My target zone is based on fib targets, support and resistance zones and previous wave 4 levels.
My worst case target is the 78% retracement 4,356$, but I don't think it will drop that low, because the overall altcoin market is too bullish.
If 9,928$ will not be breached, I expect the correction to be done already as a failed/truncated wave 5 (wave 5 of 5 of C)
If you are such a veteran as you say, why don't you post any of your counts on your blog for your followers to learn and profit from your wisdom?
Too bad Steemit doesn't allow for expanding/enlarging images. The charts I see across the platform are rather small and it's quite difficult to see any meaningful detail.
It would seem then, from what you describe, that the recent all-time-high in the 20k zone and the subsequent sharp downturn underway are rather significant 1st and 2nd waves at higher degrees of trend i.e perhaps Primary, Cycle, Super-Cycle, or even possibly Grand-Super-Cycle degree.
I would very much entertain tinkering with technical analysis of cryptos, however, my charting platform, (TradeStation) lacks any meaningful price data on such issues - not to mention lacking a significant level of historical data from which to begin any serious technical assessment.
Lastly, after 20-years, quite honestly, my interests have shifted significantly - but I do maintain an ancillary interest i.e my comments here.
Thank you for the detailed response and suggestion.
Interestingly enough, my "preferred" wave count for Gold is quite similar albeit the primary degree wave-2 down (in red) has taken several years vs. several weeks to unfold. The price data included herein goes back to 1984 (in case it's too hard to see), and each price-bar consumes one-month of price data vs weekly, daily, or intraday bars.
As a true Elliott Wave Technician, I'm certain that you maintain "alternate" counts at hand in the event that your "preferred" count blows up. I know I have always used alternates - it keeps one's mind open to the possibilities without getting to deeply or emotionally attached to any specific "preferred" count. Thanks again.
I hope they will offer enlarging images with their next hardfork. I am totally annoyed by it too, but STEEMIT is still in beta phase...
Yes, of course I keep some alternates in mind and check back up on them whenever I have to doubt my primary.
I would love to see more of your analysis and counts! (especially longterm analysis like this one in gold)
Please consider tradingview.com as a very good and free charting solution with longterm data.
https://www.tradingview.com/chart/?symbol=BITSTAMP:BTCUSD
This red wave 1 and 2 in gold is my primary count too. The problem is what should be wave 1 of red wave 3 looks threewave-ish like a wave B. I am super curious how gold is gonna perform in the coming months.
I have a CFD broker which offers over the counter "paper gold" where I can open and close positions on leverage in gold within a second, and this wave 3 would make me very happy if it plays out ;-) However, buying more physical gold for 700$/ounce would also be cool.
Hopefully you can use this charting platform and share some of your knowledge. Thanks again and greetings from germany.
edit: to enlarge an image you could use the zoom in your browser (I use firefox browser but I think others have it too)
Or you could just download the image, then open it on your PC.
Thank you for the "tradingview" link! I will certainly make it a point to check it out to see what type of charting tools are available there. PS. The edit to enlarge solution you offer in the interim is a good one, thanks! Cheers, my friend - perhaps we'll speak again sometime in the near future. :-)
www.investing.com web site also have very good charting support and I use it a lot! All my charts in my analyses blogs are from there and they have over 30 different TA tools for using them on charts.
This gold chart is interesting for me in one other perspective. It shows how all world main currencies pegged on US dollar are in inflationary cycle and are not good store of value. Governments steel silently from our pockets inflating currencies and contract their debts on our backs.
I start to use a nice unit for expressing value in gold it is mtoG or milli troy ounce of gold this is 0.31103 gram of gold and is worth about $1.34 or €1.08 at the time of writing.
As more exchanges adopt #segwit the mempool naturally gets smaller and both transaction fees and time are dropping fast! anyone selling out from btc right now is going to miss the next bull run.
Unless they time it right and buy back in at lower prices?
Looks like the 10,000 level is holding - nice long daily bullish rejection bar off the lows there. This psychological level is being heavily defended by the bulls.
I agree let's get this over with. Smash it down to 8k and then oh boy watch it rise with all the money that is itching to get in ! Without this low newbies are worried (rightly so) to jump in, so any rise would be weak !
Thank you for entertaining us with your post. Would appreciate your support in return. I'm a newbie. :)
Excellent post, thank you for sharing your insight on the markets future.
Excelent information , is very feasible