BTC chart review, Sept 27th 19:50 pst
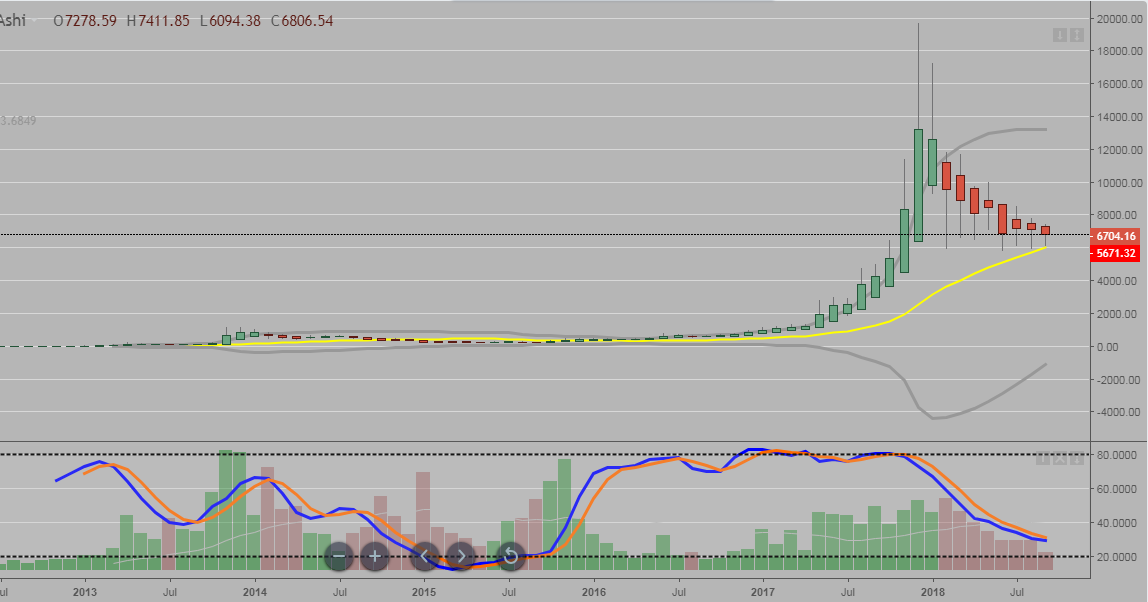
The monthly chart from Bitstamp depicts the downtrend with the red heikin ashi bars since the start of 2018.
The 20 month moving average in yellow appears to be providing a support level.
Stochastics are leveling off which is a good sign for the bulls.
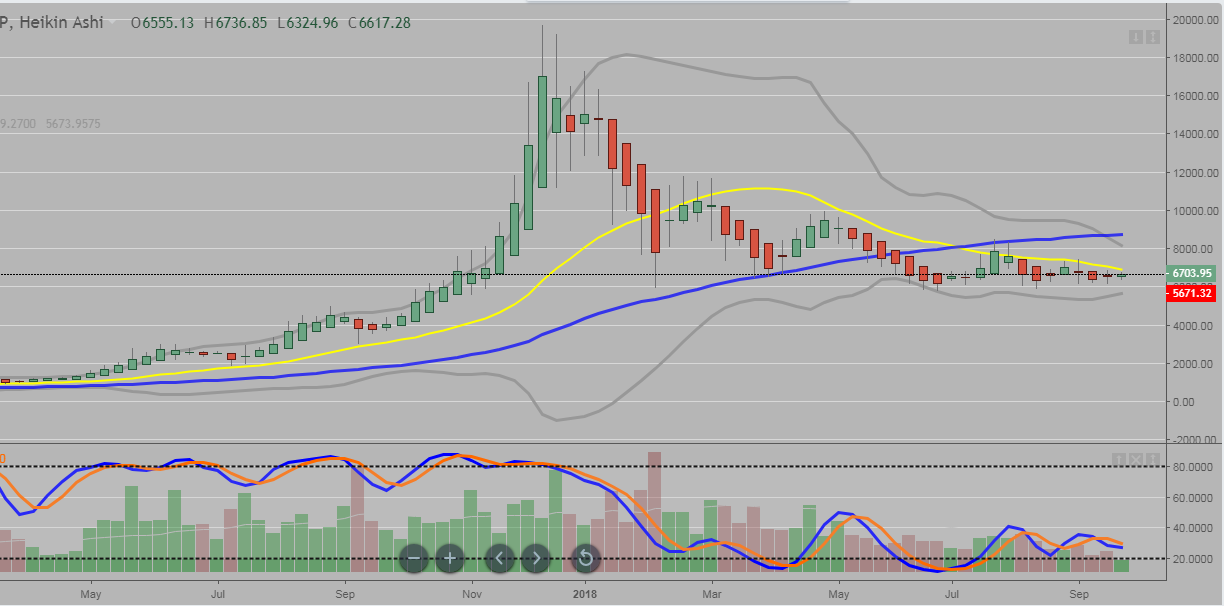
The weekly chart has price below both 20 and 50 wma's for a bearish technical chart.
The bollinger bands are tightening in on the price. It will typically break up or down eventually as most assets do not stay in a tight trading range for long.
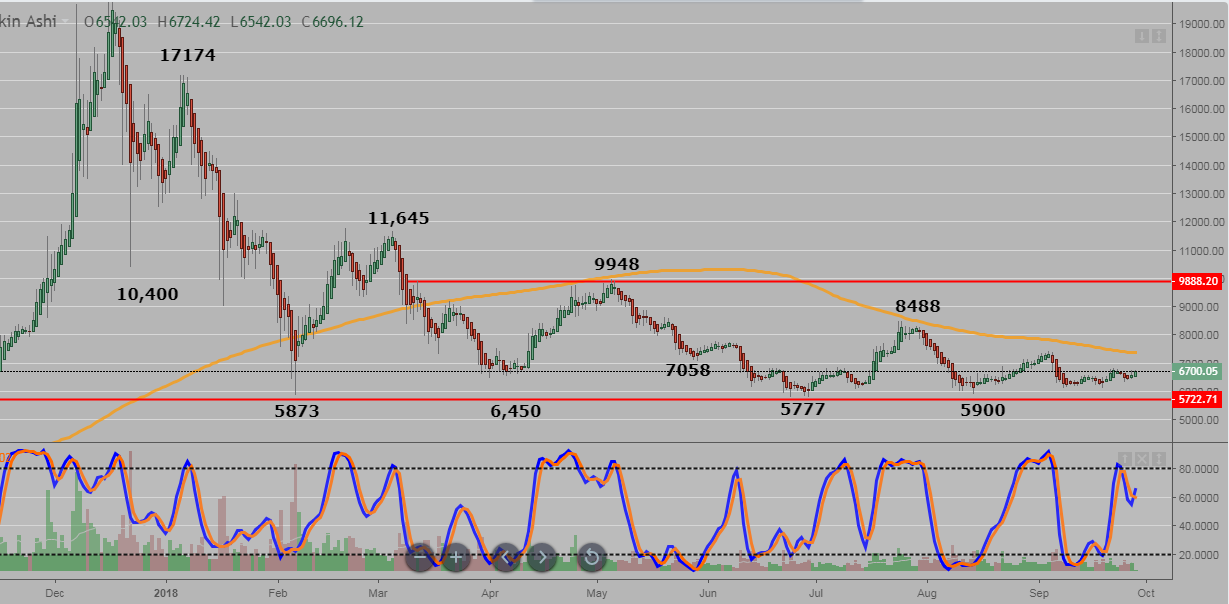
The daily chart from coinbase shows the trading range and the last major highs and lows.
It is under the 200 dma which it will need to clear in order for it to begin a uptrend. It will also need to clear the last 2 major peaks that are noted on the chart.
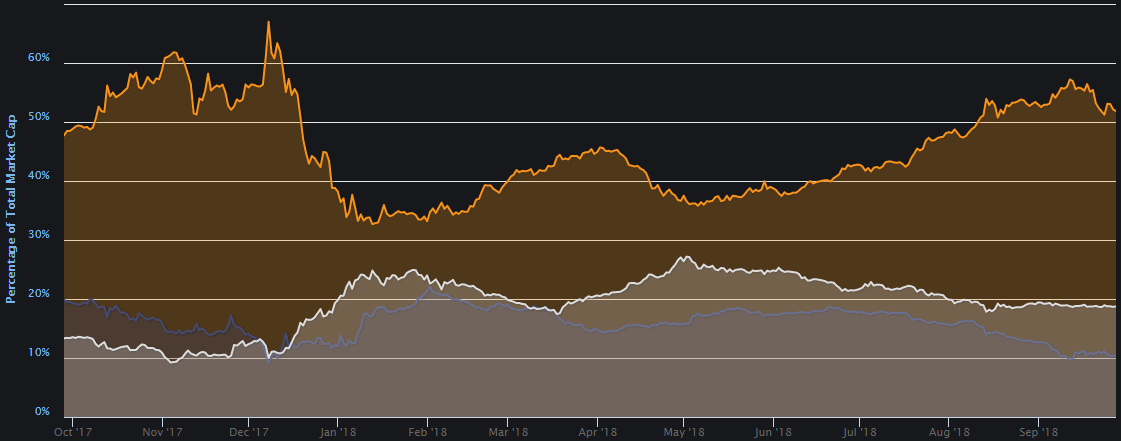
This is the 1 year marketcap chart from coinmarketcap with btc in orange and all of the alt coins in silver.
BTC has lost a bit of market cap while the alts are flat. It appears that no new money is flowing into the crypto space at this time.
I seen a few articles and videos from various sources that suggest that a bull market will start before the end of 2018. I'm not sure how they are able to predict that, but I'm sure that no one will be complaining if it does breakout in the next few months.