#USDT DOMINANCE ANALYSIS
#USDT DOMINANCE ANALYSIS
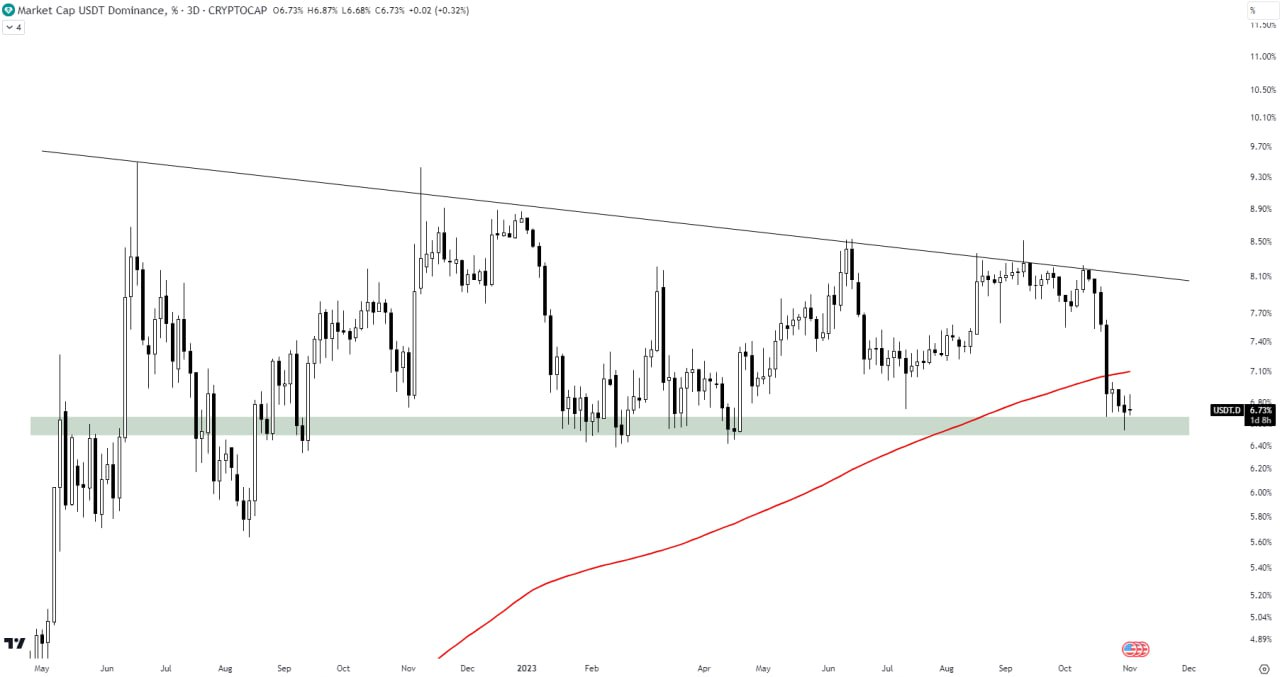
USDT.D is currently following a descending triangle pattern. At present, it is maintaining a position above the horizontal support level. Additionally, it has broken above the MA 200.
A sustained breakdown of the descending triangle would be necessary to confirm a bearish trend. It's important to note that its movements are inversely proportional to the crypto market.