All the time btc chart
Hello everyone;)
Let's have a look at Btc all the time chart. It looks like BTC sliding and almost testing previous bottom:
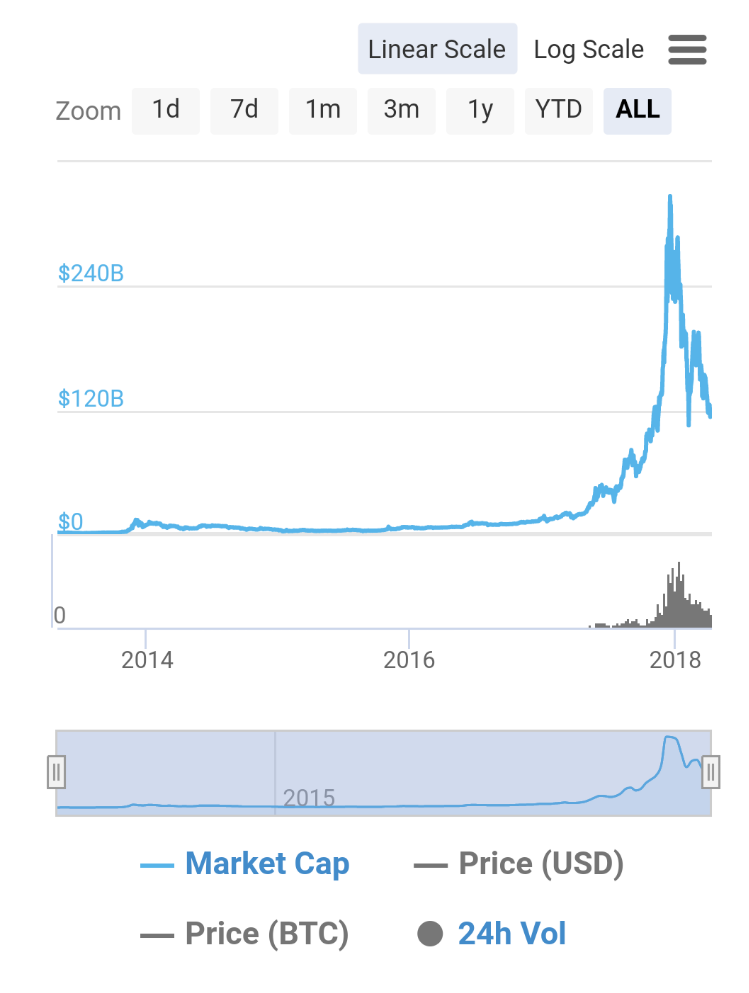
Looks like typical profit take. Typical huge profit taking. Maybe after that market will take some brief but how long that will take. Can we test even 4k$ on Btc. Thats my lower order to buy so if price will drop that big then must be correction to the top. Same otherwise like we got now. So mainly nothing strange atm with price. Just correction. Lets hope soon we will reverse to new ath.
Enjoy