BTCUSD August 22 2019 Daily Chart
.png)
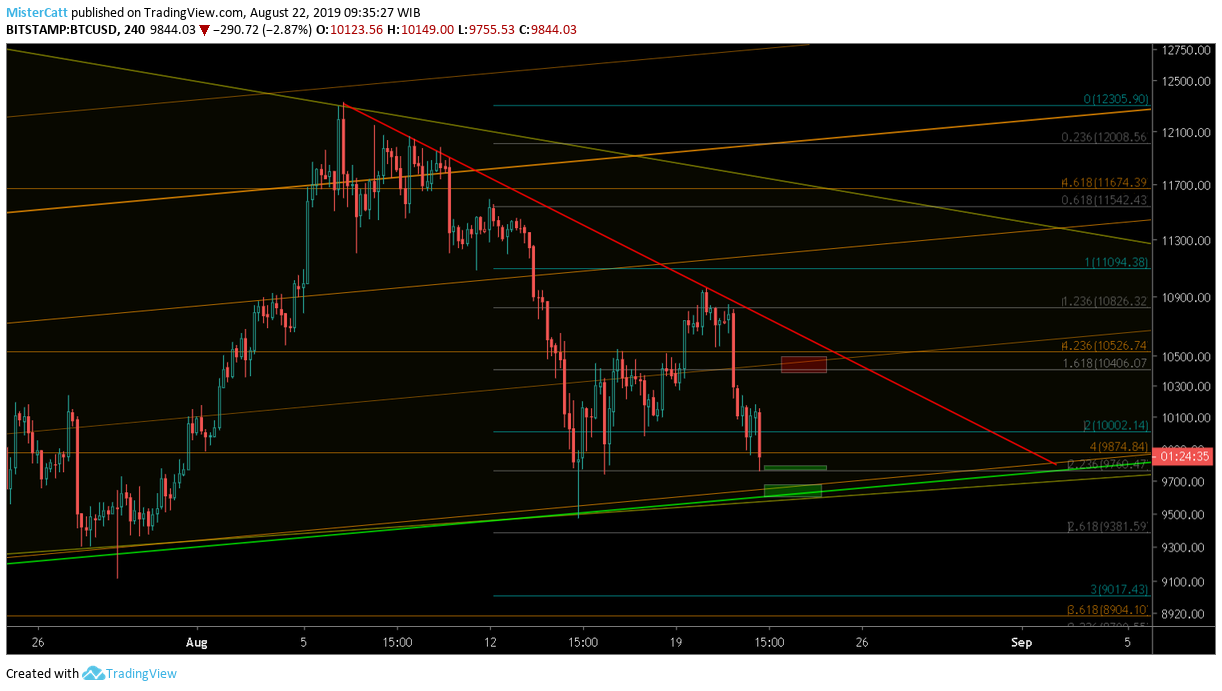
- Short term; Support : 9700 & 9500 || Resistance 10200 & 10000
- BTCUSD fallout below 10k region. Created a small bearish flag formation and looks like it would break down an estimate target around 9700 area or around green pitchfork area where the next support waiting.
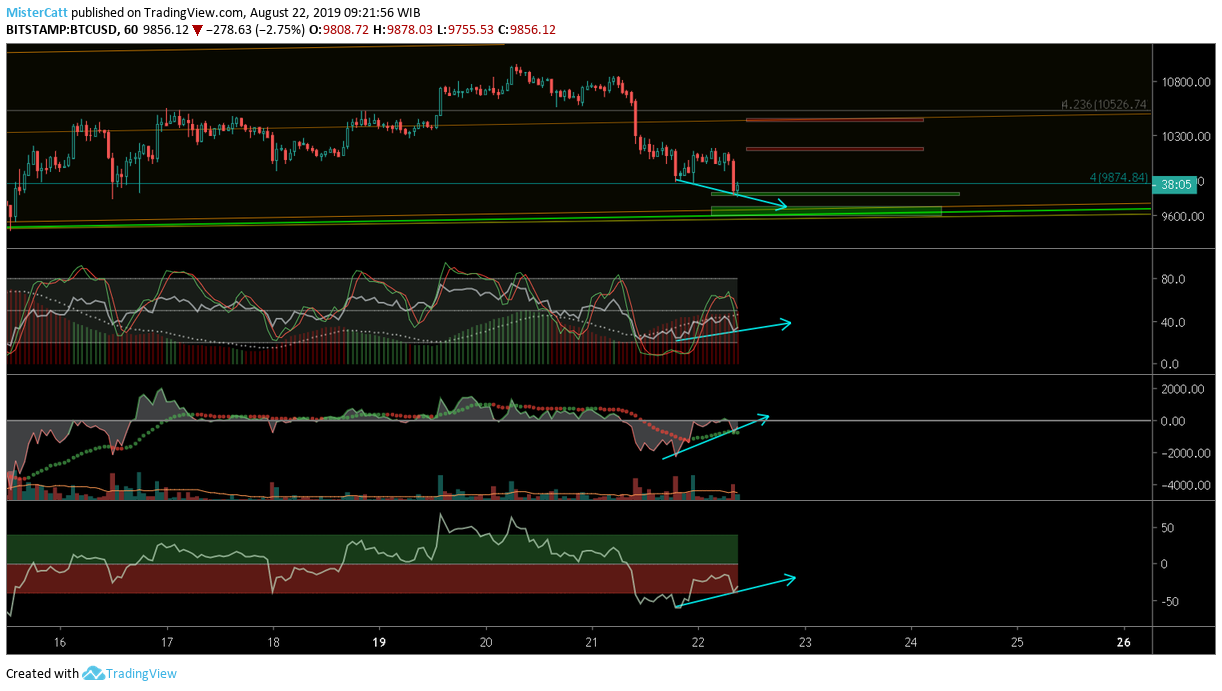
- Although it's bearish in higher timeframe, i do believe there's a possible bounce in small timeframe/struggle from bull to fight the bearish trend for a while. See the bullish divergence on 1 hour.
.png)
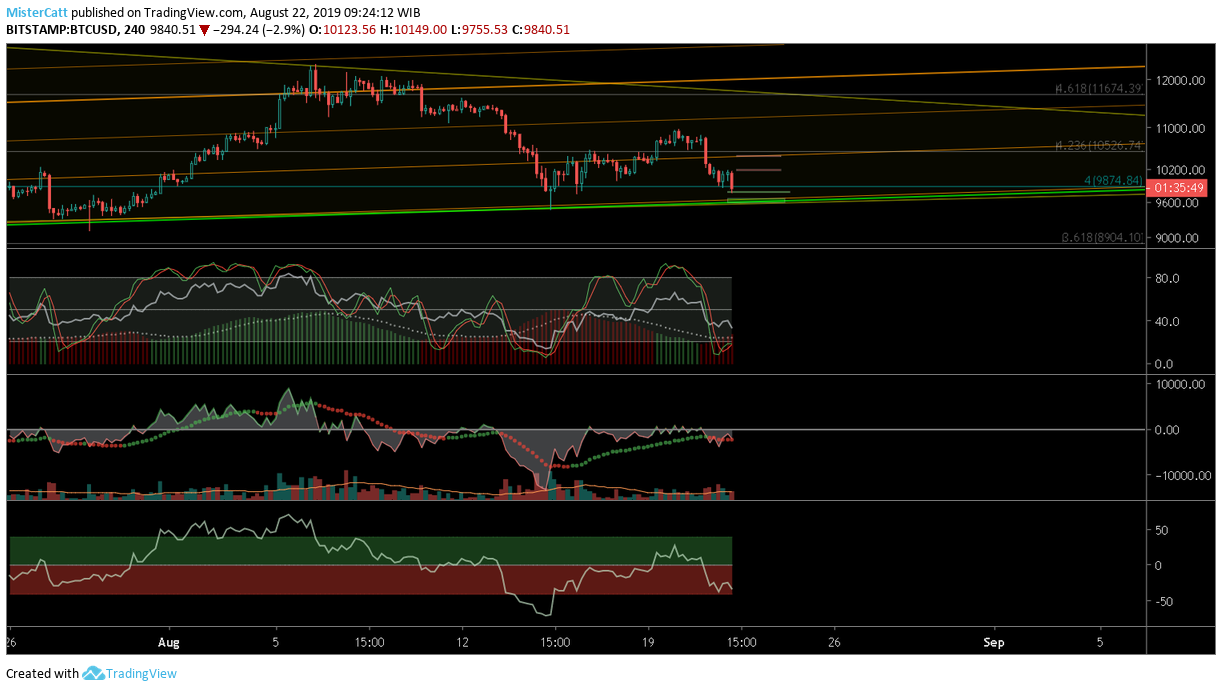
Indicator (RSI, Stoch RSI, CMF & OBV) looks bearish on 4 hour. All of my indicator all looking to enter the bearish zone and still aligned with price action movement.
Personally, I would like to see the price action below 9500 while the indicator create a bullish/hidden bullish divergence on 4 hour. While it's risky move because BTCUSD already testing the green pitchfork line 4 times ( the more the support get tested get's weaker). That's a good entry for enter long position in my opinion for short time to get a nice bounce before BTC USD decide the continuation trend. (not financial advice).
.png)
Thank you for your time to read this post and please take this idea as a grain of salt as reality always differ from what i expect as this post merely just an opinion.
and please feel free to share what your thought on comment section.
peace.