Predicting death on the Titanic
As followers of my blog will know I've been learning R and Python over the last few months and have been using Kaggle to help facilitate that effort. But last week or so I decided to start learning more about statstical models and machine learning through Kaggle's "Learn" section. I decided to enter into the "Titanic: Machine Learning from disaster" competition to test out my new skills with R. Amazingly, I did pretty well for a very first attempt at it. So I thought I'd share what I did with my code and the results.
First, the results
The model I built accurately predicted 79.904% of who lived and who died on the Titanic. That placed my model in the top 16% of all contestants - at least for now.
Next, the code
If you're not familiar with R. R is a statistical programming language and is a high level, interpreted language - meaning you don't have to code nearly as much. I've taken a small look at the coding page here on steemit and most users seem to be using python. But still the code should be easy enough to follow.
First I had to import the libraries I wanted to use for the model
library(readxl)
library(tidyverse)
library(rpart)
library(randomForest)
library(modelr)
Then I imported the data
test <- read.csv("C:/Users/***************/Desktop/Coding/R/Data/kaggle/Titanic comp/test.csv")
train <- read.csv("C:/Users/***************/Desktop/Coding/R/Data/kaggle/Titanic comp/train.csv")
Then you should take a look at the data set to understand it and see if there are problems with it. I did colnames to see all the column names in the dataset and structure function to get a quick summary. Alterantively you can use the view() function to view the whole dataset or summary() to get min, max, mean, standard deviation of each column in the dataset. The summary function can give you an idea if there are any odd outliers in the data too.
colnames(train)
str(train)
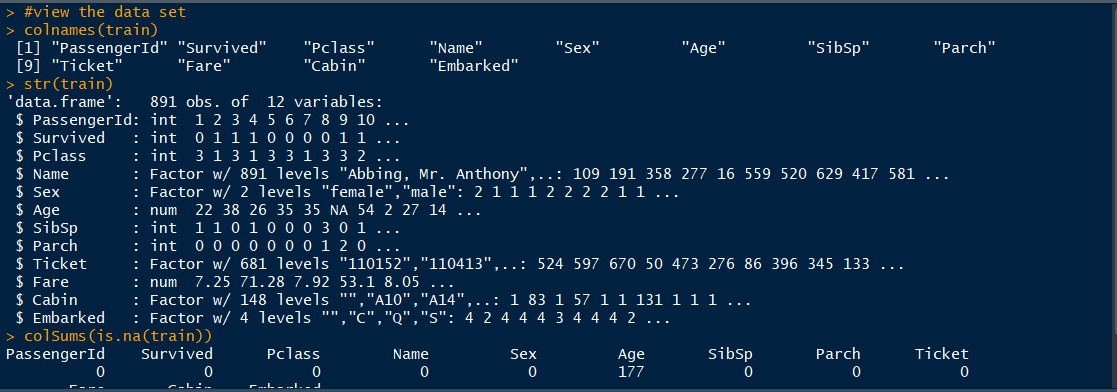
Then I checked for any missing values with is.na()
colSums(is.na(train))
I found that the training dataset has a lot of missing values for the "age" column. Which is a pretty big problem. Especially because, from watching the movie, I knew that lifeboats prioritized younger people, women, and children. I needed a way to fill in the missing ages with estimates. But I needed to make sure to not change the distribution and get a decent estimate. So I created the following:
age <- train$Age
n = length(age)
set.seed(123)
for(i in 1:n){
if(is.na(age[i])){
age[i] = sample(na.omit(train$Age),1)
}
}
set.seed creates a set of pseudorandom numbers but will be the same across any computer using R, as long as you have seed(123). Then I created a for loop with an if statement inside. I wanted to fill out the age with a sample from the existing ages without changing the distribution. So you use the sample function to do so but specify the existing ages.
After which we can check the distribution to see if it has changed by creating a histogram:
par(mfrow=c(1,2))
hist(train$Age, freq=F, main='Before Replacement',
col='lightblue', ylim=c(0,0.04),xlab = "age")
hist(age, freq=F, main='After Replacement',
col='darkblue', ylim=c(0,0.04))
The second age is the age distrubtion I created using the for loop. While the train$age histogram is the distrubtion before the replacement. The picture is shown below:
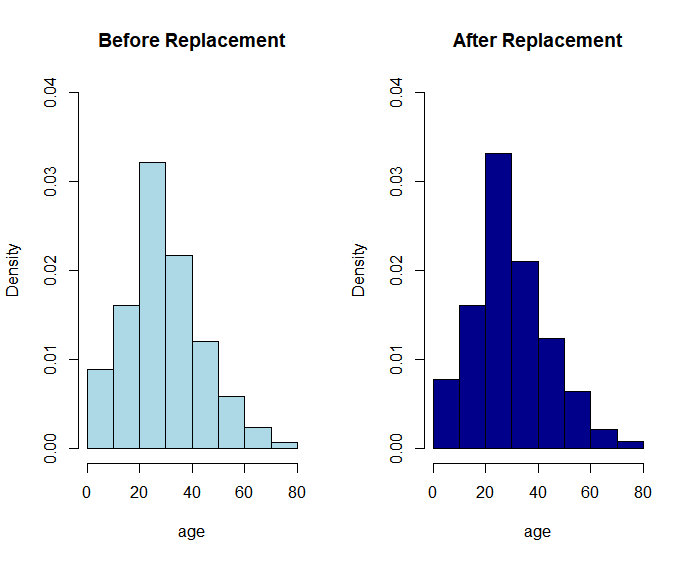
Looks like I accomplished what I set out to do. That is excellent. But then I have to put my newly generated ages back into the training dataset. (in retrospect I didn't need to but I did anyways)
train$Age <- age
#test to see if the old Age is replaced with new age vector
colSums(is.na(train))
Now with the age filled in we can start building the actual models.
I decided to test two models using only quantitative variables which are easy to do because there's no data finagling needed.
fit1 <- rpart(Survived ~ Pclass + Sex + Age + SibSp + Parch + Fare, data = train)
fit2 <- rpart(Survived ~ Pclass + Sex + SibSp + Parch + Fare, data = train)
Then I used the mean absolute error to test each model. As I expected, the fit1 model worked better than fit2 because it contained more variables.
mae(model = fit1, data = train)
mae(model = fit2, data = train)
fit1 = .251
fit2 = .262
For those who don't know. The MAE compares your predicted estimate with the actual estimate and gauges how far off you are from the training data. In my case I was off, according to the training data, by 25.1%. There are other ways to test model quality. But keep in mind that the MAE isn't senstitive to outliers. So if you are concerned about that with your data, consider using another test over the MAE.
But this means we should use our first model for prediction.
predicted.survivial <- predict(fit1, newdata = test)
print(predicted.survivial)
Next after we created our predictions we have to prepare it for the competition grading. Kaggle requires that you have all the passengers be represented by a one or a zero to represent death or survival. So I had to round the survived column to either a one or a zero. It previously had a decimal or a % probability of survival. It happened in the past so this doesn't make any sense.
solution <- data.frame('PassengerId' = as.integer(test$PassengerId), 'Survived' = predicted.survivial)
solution$Survived <- round(solution$Survived, digits = 0)
Then you create the file for submission.
write.csv(solution, file = "MyFirstSolution.csv")
One thing to note: The csv file created will have an additional row created by R. Remove the first column in the csv file so that it's just "Passenger ID" and "Survived" left. Then you can submit your prediction to the competition to see how you did. :D
If you followed my process you'll be ranked right around me, obviously. There's a group of people who have predicted them all correctly and I'm planning to work on my model some and hopefully bring up accuracy. Eventually, after I learn some more and practice more I want to bring statistical modeling to sports and try to predict the outcomes. I'd probably choose baseball because there's so many statistics there.
If you liked this content feel free to reblog, follow, and comment.
Anyways, hope you enjoyed!
Who is klabboy?
I’m different than some steemians. I have never been be paid to create content (baring likes from fellow steemians), I have never paid for upvotes, and all my content is 100% created by me. Nothing fake, no agenda, just my thoughts, and your comments.
Further, I’m a stutterer, crypto-enthusiast, economics student, data nerd, and outdoors lover. I post mostly on economics, data, personal fun/stories, and crypto. If you have an interest in those things and the occasional random topic, feel free to like, follow, and reblog my content. Hope to hear from you in the comments! Have a wonderful day!
Hello, as a member of @steemdunk you have received a free courtesy boost! Steemdunk is an automated curation platform that is easy to use and built for the community. Join us at https://steemdunk.xyz
Upvote this comment to support the bot and increase your future rewards!