🚀 Master the Market: How to Use RSI and MACD Like a Pro! (Simple Guide)
Introduction:
Hi Steemians! It's @CryptoPulse_SL here. Are you tired of guessing where the market is going? Today, I’m going to simplify two of the most powerful indicators every trader should know. Let's dive in! 📈
- RSI (Relative Strength Index) 📊
The RSI is a momentum oscillator that measures the speed and change of price movements.
Overbought (70+): When the RSI is above 70, the asset is considered overbought. This means the price might drop soon. Time to be careful! ⚠️
Oversold (30-): When the RSI is below 30, it’s oversold. This is often a great "Buying Opportunity" as a bounce back is likely. ✅
Quick Tip: Don't just buy because RSI is at 30. Wait for it to start curving upwards!
- MACD (Moving Average Convergence Divergence) ⚡
This is the "Trend Follower." It helps you see the strength and direction of a trend.
The Golden Cross: When the Blue line crosses ABOVE the Orange line. This is a BULLISH signal! 🚀
The Death Cross: When the Blue line crosses BELOW the Orange line. This is a BEARISH signal! 📉
Conclusion
Trading isn't about luck; it's about using the right tools. Combining RSI and MACD can give you a much clearer picture of the market.
What is your favorite indicator? Let me know in the comments! 👇
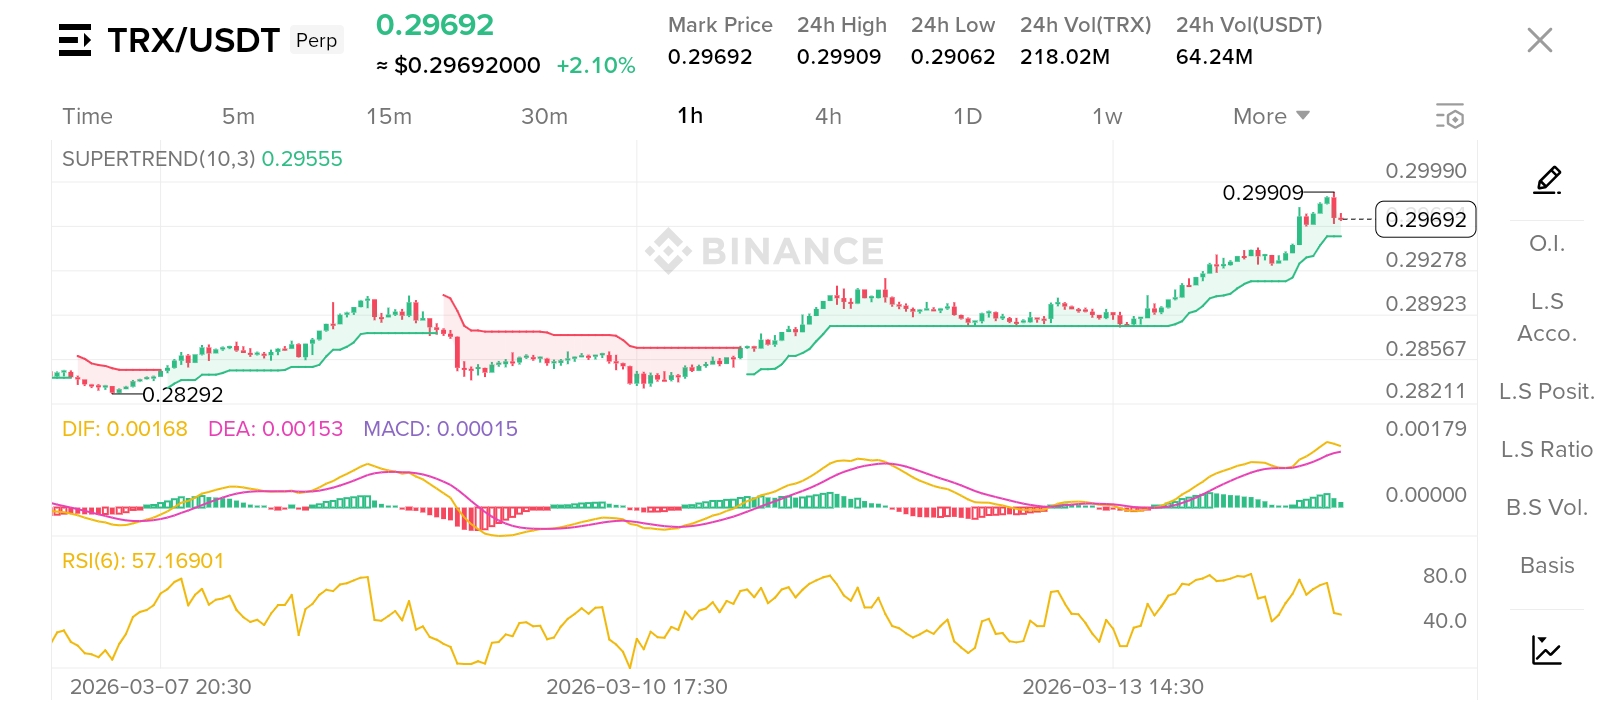
In the image above, you can see the 1-hour chart for TRX/USDT. I have used RSI and MACD to identify the trend. Currently, the RSI is around 57, indicating there is still room for upward movement before hitting the overbought zone."