Triple Bottom or Descending Triangle? - The Possibilities
Ok so I have had a more detailed look at BTC vs USD and the potential 2 options at play.
Option 1 – The dotted descending triangle is not actually a descending triangle and is the typical triangle pattern we see when a triple bottom is formed.
Option 2 – The dotted descending triangle is validated and we break to the downside of it as expected of a descending triangle .
Let’s explore option 1 first:
For triple bottoms to be valid we need 4 things to occur.
- There needs to be an existing downtrend in place – CONFIRMED
- The three lowest points should be around equal so that the trend line is horizontal – CONFIRMED
- The volume should drop throughout the pattern in a sign that bears are losing strength – CONFIRMED
- Bullish volume should increase on breakout of the resistance line – PENDING
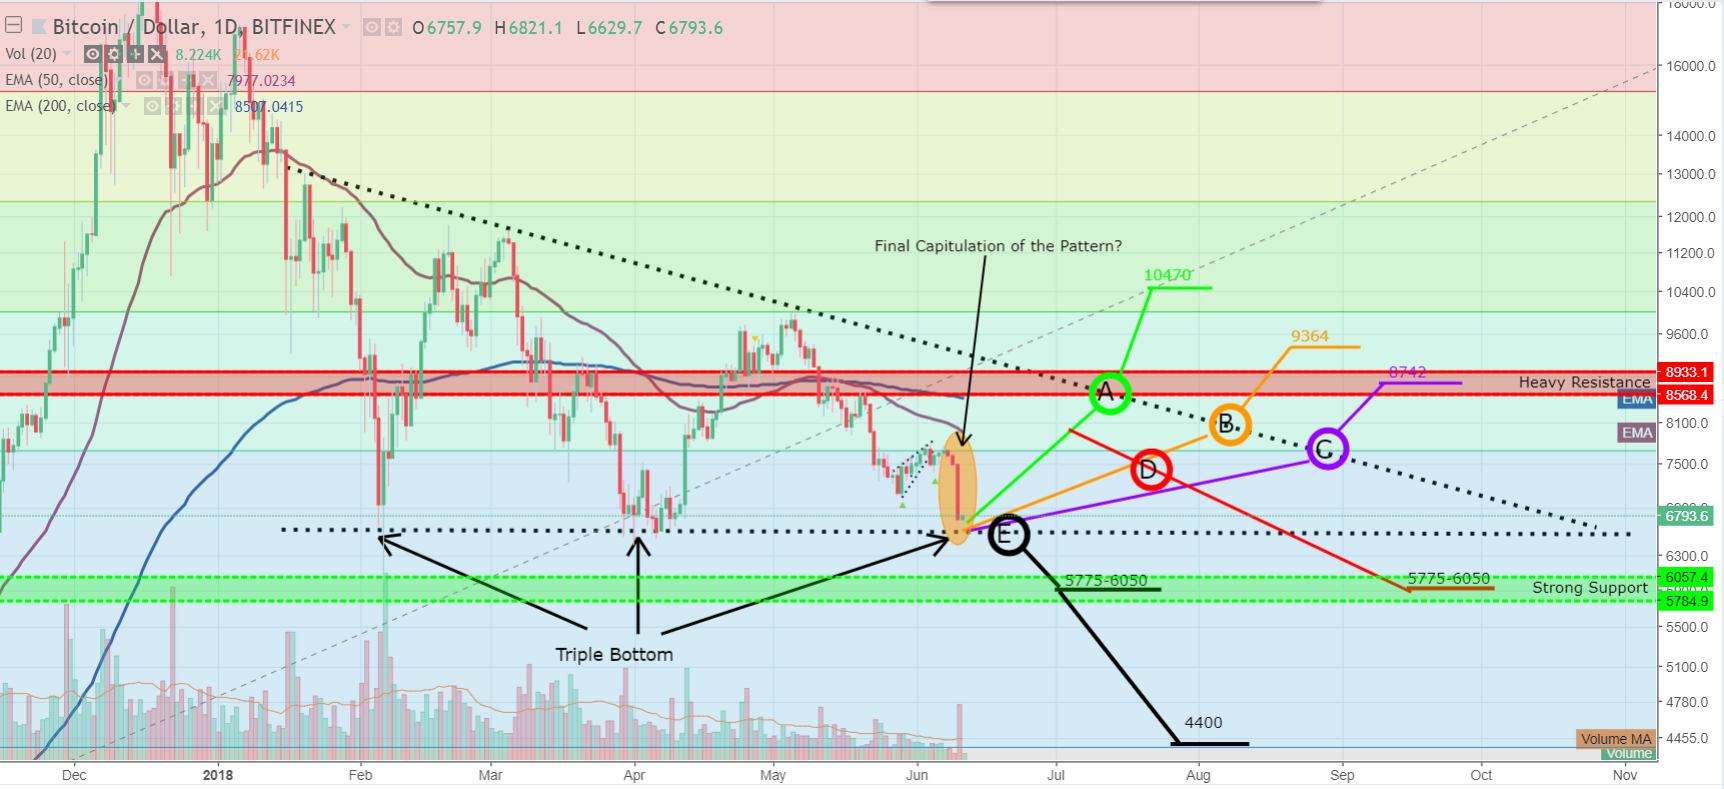
So far things are looking pretty good. If this pattern plays out, then where will head to depends on where we break out of the resistance of the triangle. Typical price targets are distance between the low and the breakout point added to the breakout point. Based on this I have given a number of possible paths and price targets should we break out:
A – A breakout at point A would take us to around 10,470
B- A breakout at point B would take us to around 9364
C – A breakout at point C would take us to around 8742
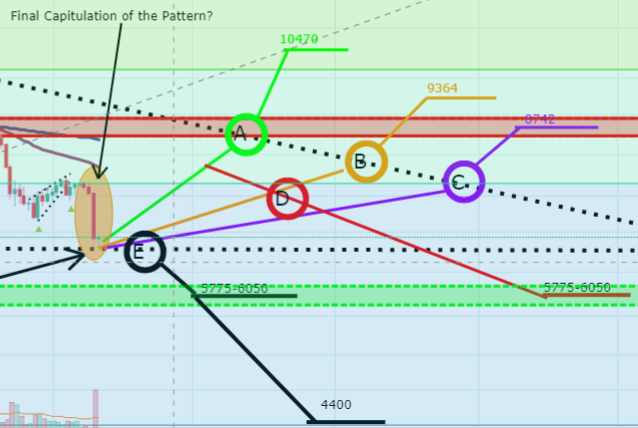
As you can see, breakouts at points A or B take us through the heavy resistance zone and we could thus confirm it as future support which would be the best outcome. Whereas a breakout at point C takes us to the middle of the heavy resistance which will likely see us retrace to test the 7700 level as new support.
Scenario D is if we do not break out of the triangle at all and takes us to our second option…. The one where the descending triangle is confirmed and we go lower.
In a nut shell scenario D basically gives us a scenario where we again confirm the down trend line as resistance and this throws us out the bottom of the descending triangle . If this occurs it would take us down to test the support provided by the strong support zone between 5775 – 6050. If we fail this support, then it is a long way down to around 4400…
Scenario E is the same as D, though we fall through the bottom of the triangle before testing the resistance of the down trend line again.