Interestingly, a 20%-30% correction from current levels would place the S&P directly into its own Golden Zone support region.
Interestingly, a 20%-30% correction from current levels would place the S&P directly into its own Golden Zone support region.
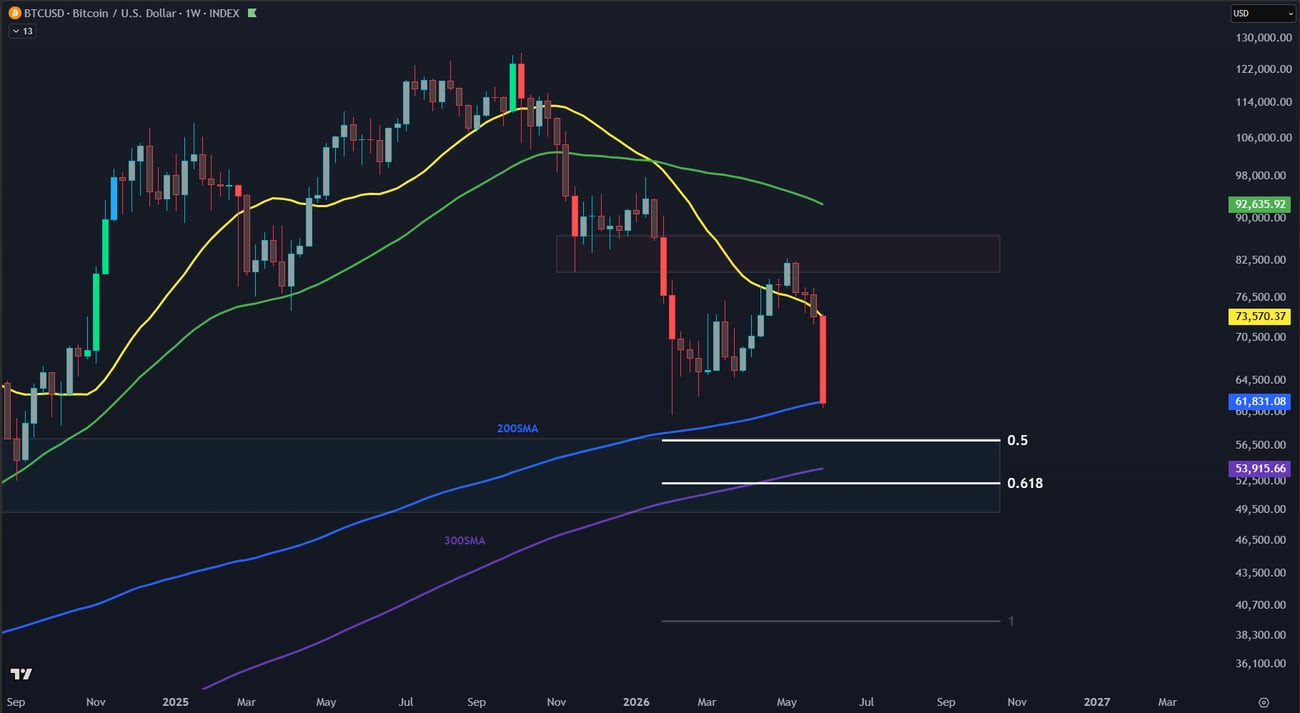
If that scenario unfolds, Bitcoin could simultaneously be testing the 200-300 SMA support cluster discussed earlier.
Could both markets be setting up for a synchronized bottoming formation?
It’s too early to know for certain.
But it is definitely something worth monitoring closely over the coming months.
Summary Table
Level Type Price Level Significance
BTC Major Weekly Resistance ~83,000 Previous Weekly Pivot High
BTC Weekly 200 SMA ~61,800 Primary Support
BTC Weekly 300 SMA ~53,900 Historical Bear Market Floor
BTC Fib Golden Zone 0.5 – 0.618 Major Confluence Support
BTC Weekly Stochastic RSI Below 80 Bearish Momentum Confirmed
BTC 12 EMA Below 26 EMA Bear Market Active
S&P VAH ~7,250 Current Value Area High
S&P POC ~6,850 Major Market Magnet
S&P VAL ~5,850 Strong Macro Support
S&P 1.272 ~8,100 Bullish Extension Target
S&P 1.414 ~8,550 Extended Bull Target
Upvoted! Thank you for supporting witness @jswit.
High-Yield Curation by @steem-seven
Your content has been supported!
Maximize your passive income!
Delegate your SP to us and earn high rewards
Click here to see our Tiered Reward System
We are the hope!
That's a thought-provoking analysis, looking forward to seeing how the upcoming months play out in both the S&P and Bitcoin markets. 📈💰