Continuation Pattern in BTCUSD
In diesem Beitrag gebe ich mir Mühe jeden wichtigen Punkt eines Patterns zu beschreiben, das für mich nahezu risikolose Einstiege innerhalb der Dynamik vom BTCUSD auf Bitmex ermöglicht.
Dieses Muster ist eher selten, jedoch sehr profitabel. Es eignet sich also für Trader, die die Geduld haben mindestens 2 Stunden zu warten und zuschlagen können wie ein "Sniper". Im BTCUSD ist das Muster relativ häufig. Erwartungshalber kann man es 3-8 Mal pro Woche erwarten, wobei man meistens 1-2 tatsächlich zu Gesicht bekommt, da man nicht immer am Bildschirm sitzen kann. Das reicht jedoch aus, denn die Trefferquote ist hoch und das Chance-Risiko-Verhältnis auch.
Dasselbe Muster gibt es auch für die Long-Seite, mit dem Unterschied, dass die Dauer des Entstehens und Vergehens des ganzen Patterns von Anfang bis Ende ein wenig länger dauert, da Angst eine mehr oder weniger flüchtigere Emotion ist als Gier.
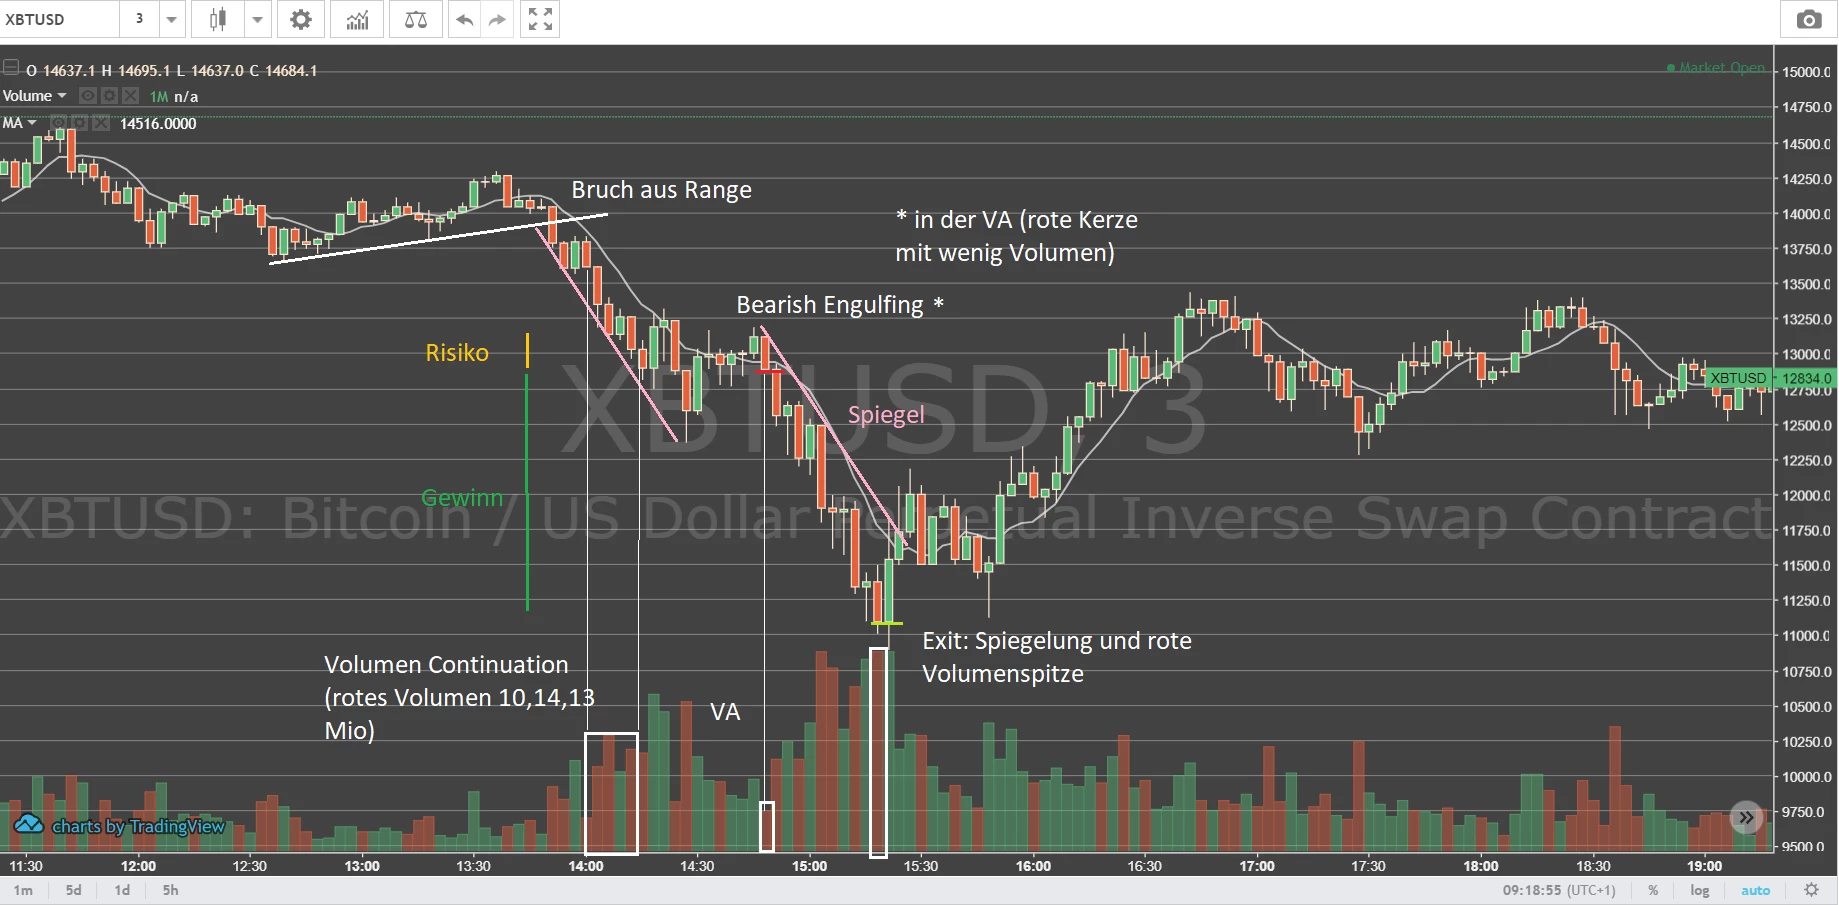
Wichtig zu verstehen: An der roten, horizontalen Linie ist der Einstieg markiert und an der grünen der Ausstieg.
Punkt 1: Volumenaufnahme (im 3 min Chart: mehrere Kerzen mit mehr als 6 Mio Kontrakten, im 1 min Chart: 2 Mio Kontrakte)
Punkt 2: Bewegung ohne deutliches Verlassen der 9er EMA (Exponential Moving Average)
Punkt 3: Volumenabnahme abwarten mit einer roten Kerze für das Shortbeispiel (mindestens die Hälfte bis ein Drittel des durchschnittlichen Aufnahmevolumens)
Punkt 4: Entry: in Bitmex am besten Market, da der Markt oft schnell anzieht, Verlustbegrenzung: ~ 100 Punkte / Risiko nach wahl (0.5-3% vom Kontostand)
Punkt 5: Spiegelung abwarten und dann Volumenspitze abwarten zum Exit (am besten per Limit)
In this post I took effort to describe every important point of a pattern that lead myself to many almost risk-free signals inside the dynamics of BTCUSD on Bitmex.
This pattern is quite rare but highly profitable. It is for traders who have the patience to at least wait for 2 hours and execute the trade "like a sniper". In BTCUSD this pattern is quite frequent. You can expect to see it 3-8 times per week, saying that you most likely will see it only 1-2 times because you can't sit on your computer all the time. Despite that, it's enough occurences because the hit rate is high and also the risk reward.
Same pattern exists for the long side (which usually takes more time because fear is mostly a more elusive emotion than greed).
Important to understand: At the red, horizontal line is the entry and at the green line is the exit.
Point 1: Volume Continuation (3 min Chart: multiple candles with contracts > 6 Mio, in 1 min Chart: > 2 Mio)
Pointt 2: Price movement without clear exiting the 9 EMA (Exponential Moving Average)
Point 3: Wait for volume decline in a red candle for the short example (at least half or a third of the average Volume Continuation Volume)
Point 4: Entry: in Bitmex it's best to go market with this setup because the market often tightens up at these points , Stoploss: ~100 Points / risk of choice (0.5-3% from the account balance)
Pointt 5: wait for mirroring the price movement (pink line) and then exit when there is a volume peak that is higher than the volume continuation (best to exit with a limit order because we are not in a rush at this point)
Ich hoffe das hilft euch um gute Einstiege zu finden, die man mit Hebel ausnutzen kann ;)
I hope this helps you in finding another good entry that you can exploit with leverage ;)
Bleibt geduldig / Stay patient,
Niclas
super Beitrag und durchaus hilfreich:) freue mich auf mehr und werd erstmal "follown" :) vielen Dank:)
Da wird demnächst noch mehr kommen! Danke :)
echt viel Arbeit reingesteckt! werde dir mal folgen