Great buy spot for Stellar (XLM)
Hey guys! I'm back!
Here we go for a XLM analysis
Timeframe: Daily (1D)
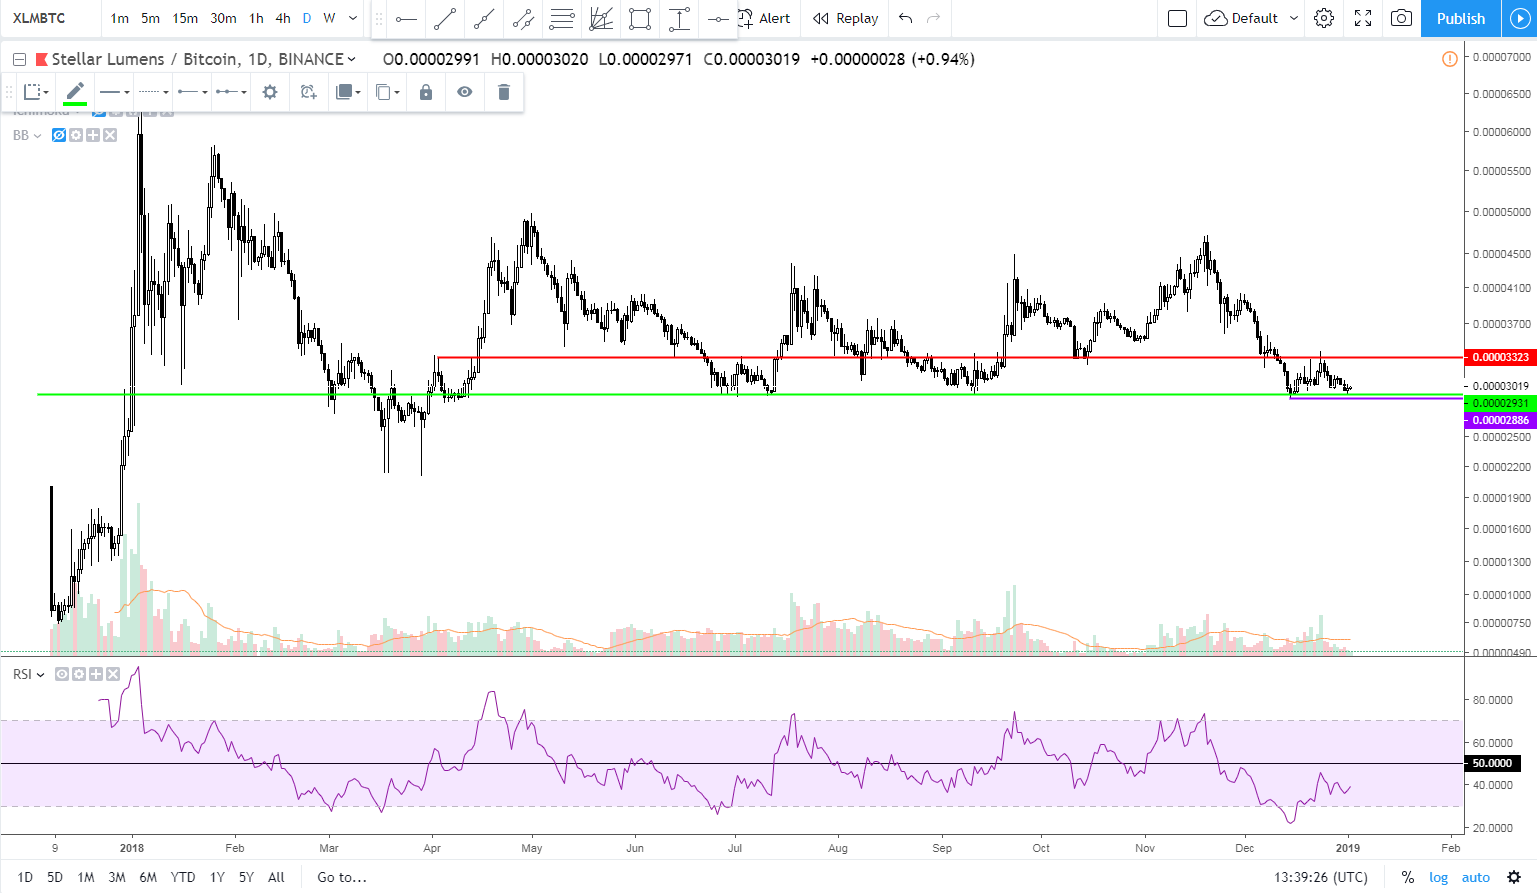
Analysis: So here we are getting to the accumulation zone, we have a strong horizontal support around 2930 sats (green line), it's where whales are accumulating XLM. Red line is the next horizontal resistance (possible first target) and purple is the last low to use as a STOP (around 2886 sats, I'd put a little bit below it)
Risk: 1.5%
Reward: 13% (first), ~50% next
So, we have to be right only 11% of time for a profitable trade. (aiming for the first target only)
Also, the RSI shows a bullish divergence and volume decreasing, both good signs:
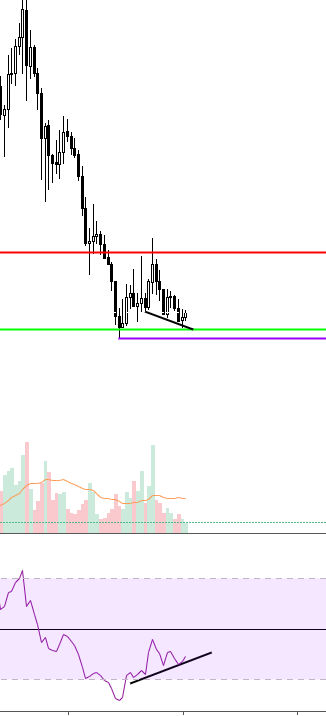
Let's see the 4h graph:
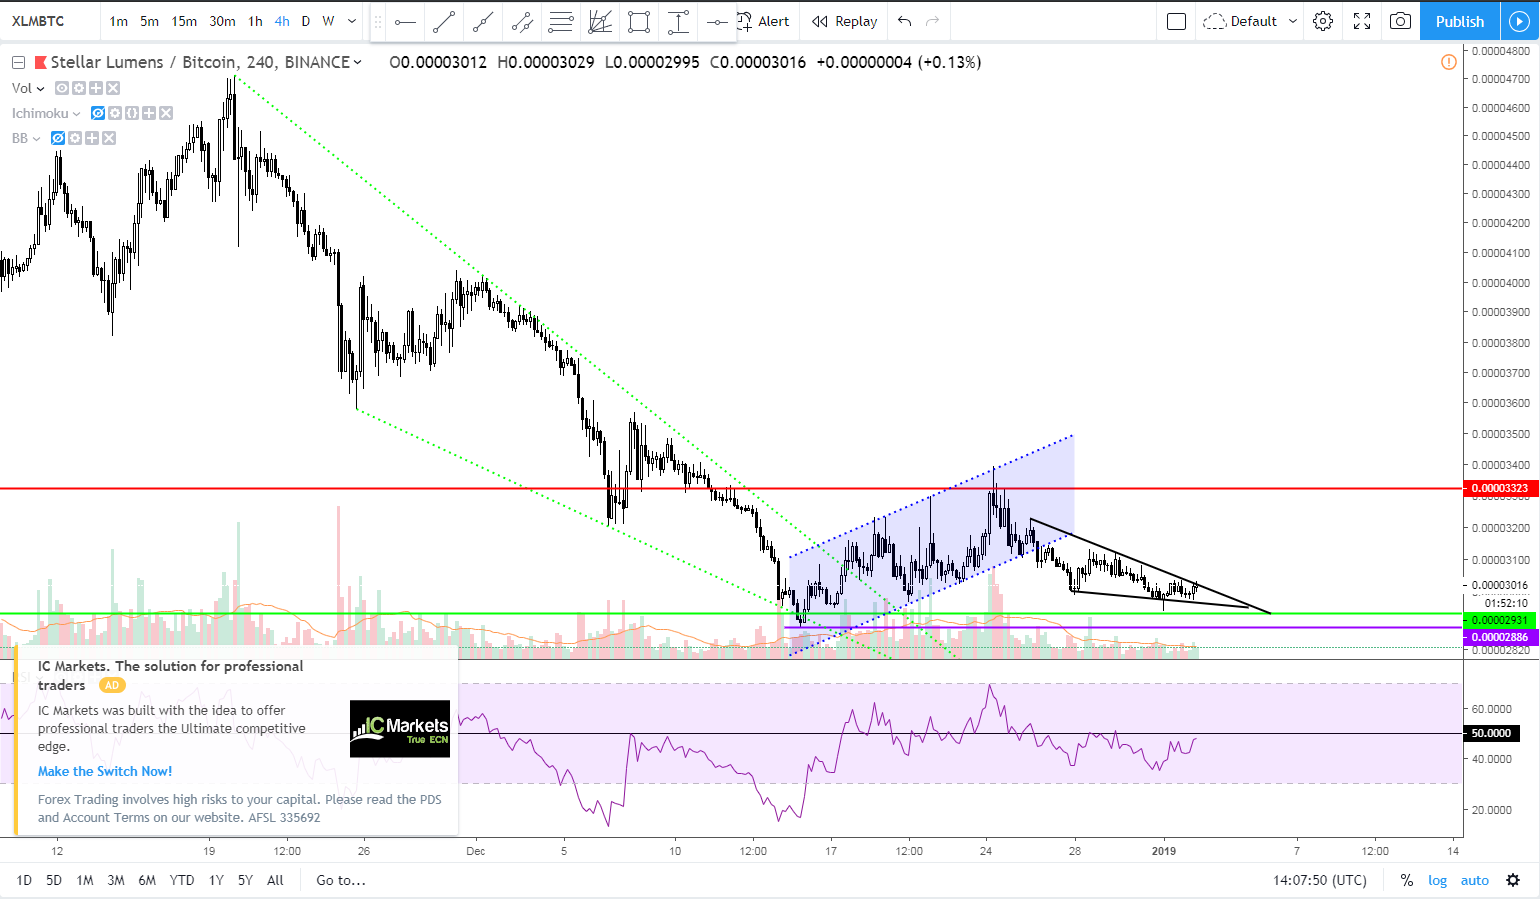
Here we have another bullish reversal pattern: a Falling Wedge, so it could break out of it before reaching the support again, in this case we can buy the breakout too or even wait for a breakout+retest.
So that's it. Trade safely.
Cya!