Bitcoin Price Prediction - We Know What the Price Will be on March 30th

Yes, we know that it is a bold statement to make. However, while nobody can really predict the future, we already came really close a few times in the past. Our technical analysis published on February 21st also quoted a wild private Bitcoin price prediction posted by a member of our TA team at the end of 2019. Obviously, it was spot on, just the same as the whole analysis.
Therefore, this time, we are taking another step forward in our price forecasting. We are looking at BitMEX BTC/USD perpetual daily chart as it reveals some fantastic patterns. Without further ado, let's dive straight into it.
The Triangle
As is it is often the case, Bitcoin is inside a triangle. In a daily chart, the triangle formation started a bit more than a year ago, on February 8th, 2019 at the price of $3,373.
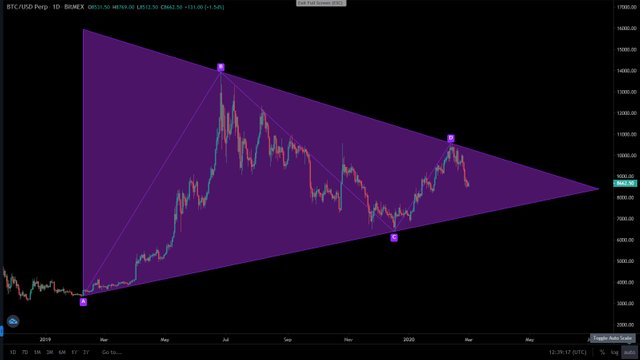
This gigantic triangle is of the symmetrical nature, which doesn't give away any future movement possibility. However, what we can see is Bitcoin hitting the lower high resistance trend line at $10,500 and descending towards the lower levels.
Some may say that the formation isn't confirmed until the price touches the trend lines at least three times. Add they would be right. Still, there are some other indicators we use when predicting the price of the cryptocurrency.
Bitcoin Price in Correlation With Fibonacci
Once Bitcoin (BTC) started to descend, naturally, we wanted to find out where will the sell-off possibly stop. In order to do that, we have taken a look at the Fibonacci retracement.
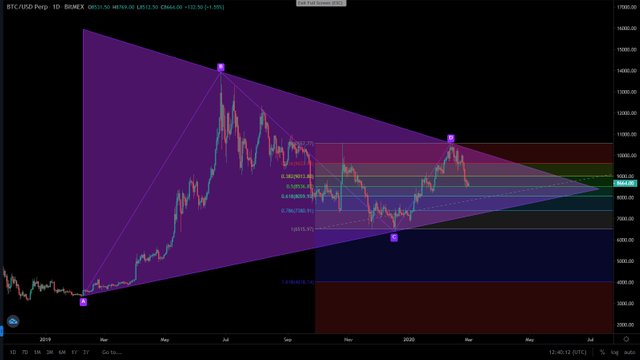
The chart above reveals that BTC already declined below the two major Fibonacci levels. Currently, the 0.5 retracement level still holds and acts as a support. But how long will it keep supporting Bitcoin?
Let's just say that the forecast isn't half as bright as some may lead you to believe.
Still, before we embark on that route, let's conclude our Fibonacci research with the time zones. Fibonacci time zones may help us predict the date when a bigger move in the market may happen. So, let's see what it says.
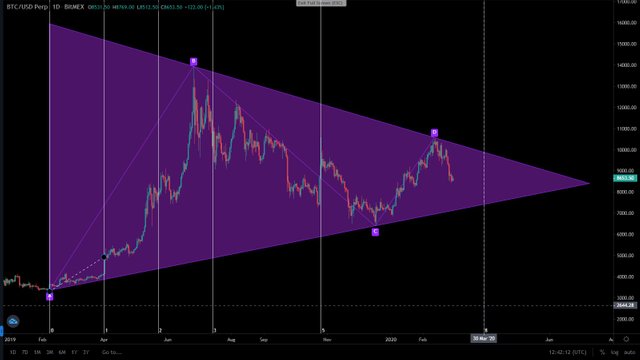
We can see that, more or less, the time zones coincide with the price spikes in the chart. This can help our approximate Bitcoin price prediction. However, it doesn't give us the right to make such a bold claim as we did in the title.
Nevertheless, something else might.
Time-Related Bitcoin Price Prediction
Maybe the Fibonacci Time Zones indicator couldn't provide the edge we needed. Therefore, we decided to go even more in-depth with different time-frames and see if that could help us a bit more.
Once we added the Time Cycles along with the Fibo Time Zones indicator to our chart, the amazing happened.
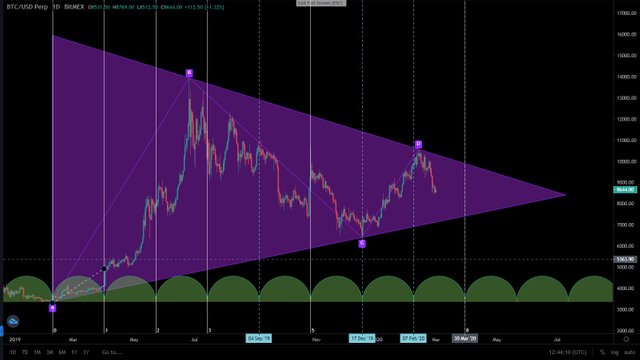
While Fibonacci Time Zones were loosely marking bigger market movements, the Time Cycles indicator pointed out bottoms and peaks - with a 100% accuracy. While this is really cool to take notice of, in fact, it reveals much more.
It reveals that, apart from bigger market cycles, Bitcoin also acknowledges shorter cycles, making it much easier to predict the mid-term price movement. However, as always, we have to combine the different axis of the analysis to better understand the whole mechanism we like to call the bigger picture.
Bitcoin Price Prediction for March 30th (Yeah, really)
When we combine the triangle formation analysis along with the Fibonacci retracement and time-oriented indicators, the magic happens.
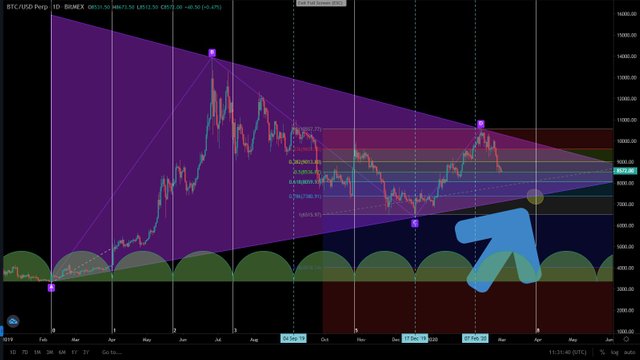
The chart above reveals that the strongest historical support at $7,400 coincides with the 0.786 Fibonacci retracement level. On the other hand, when we look at the symmetrical triangle, it becomes clear that all four relevant indicators come together in this one point in time.
Exactly on March 30th, the Fibonacci retracement 0.786 level, the Fibonacci Time Zones indicator, the Time Cycles, and the triangle's lower trend line join together at $7,400, exactly.

Of course, just like always, we suggest using this technical analysis with utmost caution and precautions. Please, bear in mind that, while technical analysis is right in the majority of cases, in some unpredictable fundamental scenarios, it may be overruled by the overwhelming overall sentiment.
Therefore, keep your wits sharp and stop-losses tight.
All charts in the article were analyzed on Coinalyze.net – the professional trader’s analysis tool.
Disclaimer:
You should look elsewhere for investment advice since this isn’t it. Even if it looks like it, it’s not. Cryptocurrencies are extremely volatile and risky speculations. Always do your own research. Consider consulting an investment professional prior to investing your money.
When you start feeling the irresistanbe urge to share our content and click on one of the icons below, you'll be rewarded with Sharpay (S) Tokens.
Now, ain't that cool or what? Getting paid for sharing!!
Of course, to receive your tokens, you'll need a Sharpay crypto wallet. Therefore, first you need to register on Sharpay's OFFICIAL WEBSITE and the wallet is there.
Thanks for sharing!
      mark {

           background-color: GAINSBORO
;
           font-weight: normal;

           font-style: normal;

      }

 </style>
😉
Originally published on CoinSyncom: https://coinsyn.com/cryptocurrency-technical-analysis/bitcoin-price-prediction-march/
Hi! I am a robot. I just upvoted you! I found similar content that readers might be interested in:
https://coinsyn.com/cryptocurrency-technical-analysis/bitcoin-price-prediction-march/