BTCUSD Daily Chart update - June 18, 2018
https://www.tradingview.com/x/zcy2mqzk/
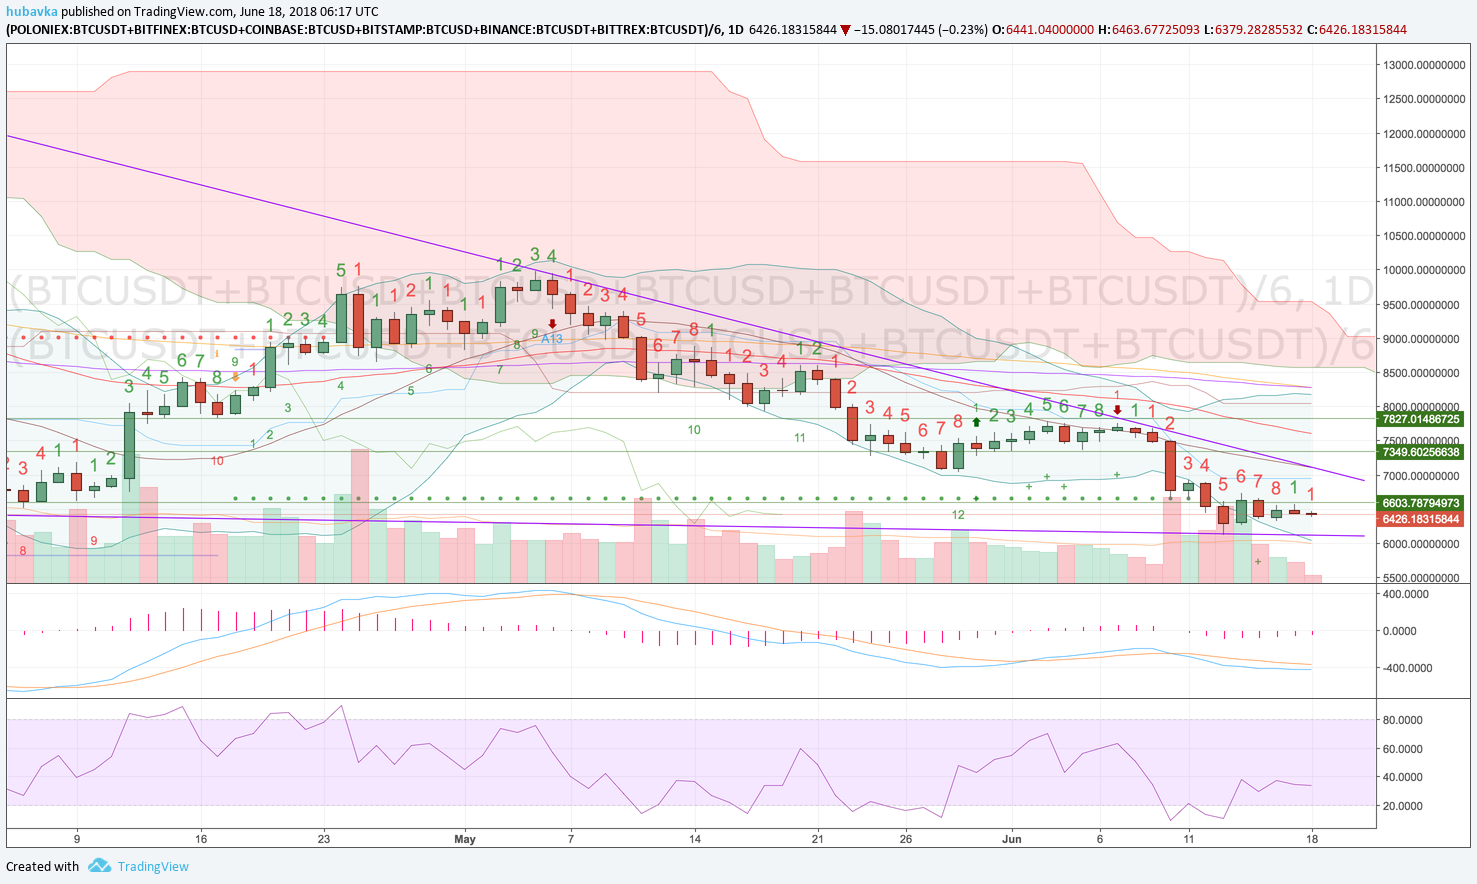
Yesterday the price mange to get to $6,575 only and could not break $6,600 resistance. So far today price is in an even tighter range. The TD indicator flipped back to red 1. Volume is very low as well. Not much to say until we break either $6,600 to the upside or $6,300 to the downside. I still like the scenario in which we will have a slingshot reversal near $6,000 and a violent upswing. BB bands on 4 hour chart are getting tight and a move in either direction should be expected soon.
Weekly: Down
Daily: Neutral
4 hour: Down
1 hour: Neutral
Prediction for the day
Another test of the $6,600 area
If you don't have a BitMEX account yet please use this link to register and get 10% off commissions:
https://www.bitmex.com/register/WGhKhX
Signup for the first fully decentralized ALT coin exchange:
https://www.altcoin.io?kid=KAVYG
Go here https://steemit.com/@a-a-a to get your post resteemed to over 72,000 followers.