Ripple Price Analysis: XRP/USD Could Resume Decline Below $0.34
Key Highlights
- Ripple price failed to move above the $0.3900 and $0.4000 resistance levels against the US dollar.
- Yesterday’s crucial bearish trend line is active with resistance at $0.3620 on the hourly chart of the XRP/USD pair (data source from Kraken).
- The pair could decline once again as long as it is below the $0.3620 and $0.3720 resistances.
Ripple price failed to gain traction above key resistances against the US Dollar and Bitcoin. XRP/USD is likely to slide again below $0.3400 in the near term.
Ripple Price Analysis
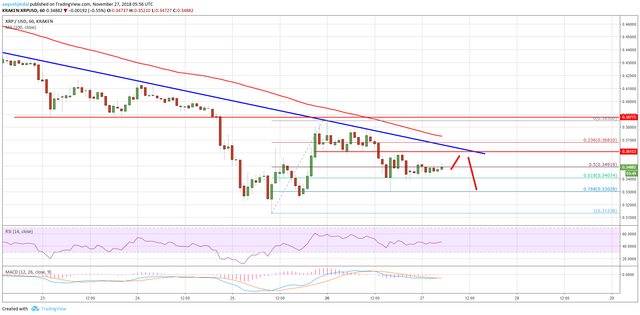
Yesterday, we saw a minor upside recovery above the $0.3600 level in ripple price against the US Dollar. The XRP/USD pair even traded above the $0.3800 level, but it struggled to clear the $0.3850 and $0.3900 resistances. There was also a rejection noted near the $0.3850 level and the 100 hourly simple moving average. Besides, the price failed to stay above the 61.8% Fib retracement level of the last drop from the $0.4140 high to $0.3125 low.
As a result, there was a fresh decline below $0.3700 and the price moved back in a bearish zone. During the decline, the price broke the 61.8% Fib retracement level of the last wave from the $0.3133 low to $0.3850 high. The price tested the $0.3300 level where buyers emerged. Moreover, the 76.4% Fib retracement level of the last wave also acted as a support near $0.3302. On the upside, an initial resistance is near the $0.3600 level. More importantly, yesterday’s crucial bearish trend line is active with resistance at $0.3620 on the hourly chart of the XRP/USD pair.
Looking at the chart, ripple price is clearly facing a lot of hurdles on the upside near the $0.3600 and $0.3620 levels. On the downside, a break below the $0.3400 level could really increase selling pressure.
Looking at the technical indicators:
Hourly MACD – The MACD for XRP/USD is slightly placed in the bearish zone.
Hourly RSI (Relative Strength Index) – The RSI for XRP/USD is just around the 50 level.
Major Support Level – $0.3400
Major Resistance Level – $0.3620
Thanks for reading! Let us know what you think. Share your thoughts in the comment section below!
⭐Join our Facebook Community
⭐Sign up to our Free Daily Newsletter
💰Buy Bitcoin on Coinbase (Get Free 10$)
💰Top 3 Recommended Exchanges to Buy Altcoins:
👍#1 Binance
👍#2 Cryptopia
👍#3 Coinexchange
☛Follow us on Facebook: https://www.facebook.com/Cryptobble/
☛Subscribe to our Youtube Channel: https://goo.gl/YHYi1B
☛Follow our Twitter: https://twitter.com/cryptobble
☛Join the Discussion on Telegram: https://t.me/cryptobblechat
☛Check us out on Instagram: https://www.instagram.com/cryptobble/
Posted from my blog with SteemPress : https://cryptobble.com/2018/11/27/ripple-price-analysis-xrp-usd-could-resume-decline-below-0-34/
Warning! This user is on my black list, likely as a known plagiarist, spammer or ID thief. Please be cautious with this post!
If you believe this is an error, please chat with us in the #cheetah-appeals channel in our discord.