JAPANESE CANDLES

Japanese candles are a technique of graphic representation and analysis used in economics initially by the Japanese. They arise in Japan in the eighteenth century.
The graphics (candles) and its analysis is one of the most important methods of technical analysis and is an effective and powerful tool for the planning and analysis of the stock and merchandise market.
The Japanese candles visually shows the psychology of the market, as well as shows us the situation offer-demand and liquidity of the market.
These techniques apply to market study of the Criptomonedas
Price charts with respect to the time shown by POLONIEX are precisely this technique.
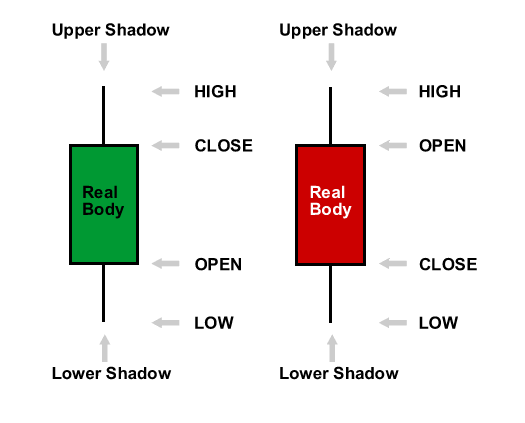
The candles can be characterized in the following way:

There can also be several types of candles that can be classified by:
Pattern: Indecision, continuation, reversal, confirmation.
Trend: Neutral, bullish, bearish.
Reliability: Very low, low, moderate, high very high.
According to these types of classification there are a large number of candles. In this post I will show you some of them.

Long Lower Shadow
Pattern: Reversal.
Trend: Bullish.
Reliability: Moderate.
Which means: In bearish tendency it means a bullish advance.

Long Upper Shadow
Pattern: Reversal.
Trend: bearish.
Reliability: Moderate.
Which means: in the upward trend it means a bearish advance.

Piercing Line
Pattern: Reversal.
Trend: Bullish.
Reliability: High.
What it means: reversal in bearish trend, more reliable as the lower open the bullish candle (blue).

Dark Cloud Cover
Pattern: Reversal.
Trend: bearish.
Reliability: High.
Which means: reversal in bearish trend, more reliable as the higher open the bearish candle (red).

Three Outside Up
Pattern: Reversal.
Trend: Bullish.
Reliability: Very high.
Which means: Only in bearish tendency, reversal with upward trend.

Three Outside Down
Pattern: Reversal
Trend: bearish.
Reliability: Very high.
Which means: only in upward trend, reversal to bearish tendency.

Kicking Bullish
Pattern: Reversal
Trend: Bullish (bullish)
Reliability: High.
Which means: strong upward development, both candles must have their small shadows.

Kicking Bearish
Pattern: Reversal
Trend: bearish.
Reliability: High.
Which means: strong bearish development, both candles must have their small shadows

On Neck Line
Pattern: Continuation.
Trend: bearish.
Reliability: Moderate.
Which means: bearish, more reliable when there is a decrease in the blue candle.

Tweezers Bottons
Pattern: Reversal.
Trend: Bullish.
Reliability: Moderate.
That means: reversal of bearish to bull, may not be direct, but identifies a support that precludes the continuity of the trend.

Tweezers Top
Pattern: Reversal.
Trend: Bearish
Reliability: Moderate.
Which means: reversal of the bearish bull, may not be direct, but identifies a stand that precludes the continuity of the trend.
One thing we must understand is that the meaning of each candle separately may not say anything about the future trend of the market.
Other methods of analysis need to be used, such as:
The pattern of 8 to 10 candles.
When presented in 8 and 10 sessions of bullish (candles) records there are possibilities for change in the preceding trend.
There should be no more than two or three side-action logging sessions between registration sessions of the same trend. Otherwise you start the account again.
Numbers eight to ten are not exact the market can change between six and twelve registration sessions.
From Bullish to bearish

From Bearish to Bullish

The Bollinger Band
Bollinger Bands is a tool invented by John Bollinger in the 1980s as well as a term trademarked by him in 2011.[1] Having evolved from the concept of trading bands, Bollinger Bands and the related indicators %b and bandwidth can be used to measure the "highness" or "lowness" of the price relative to previous trades. Bollinger Bands are a volatility indicator similar to the Keltner channel. Source


As you can see in the figures above when the candles play the bands are the top or bottom. It can be interpreted as the next arrival of a change in the market trend.
which can give a hint about the appropriate moments to buy or sell.
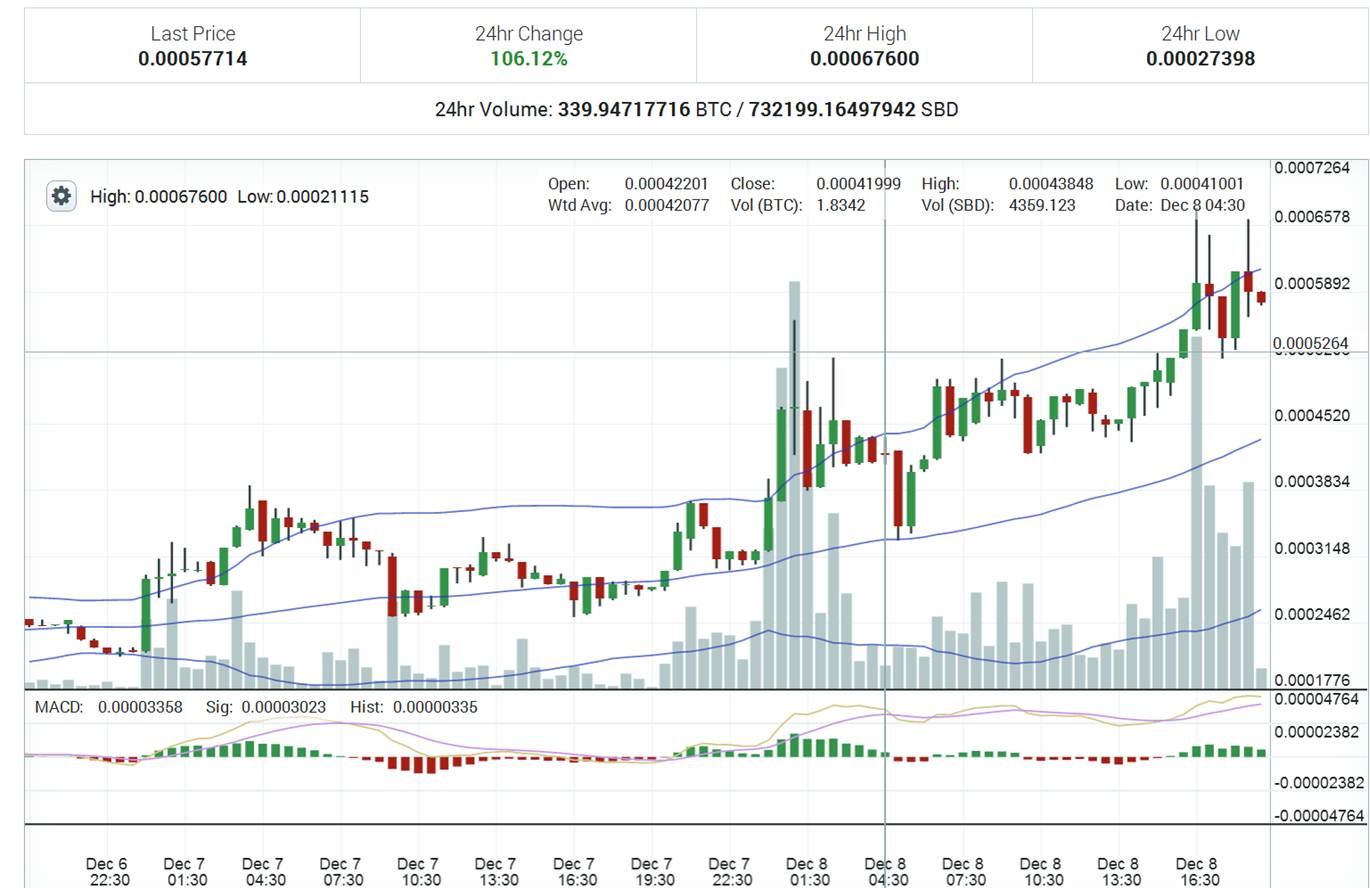
Here I show a picture of Poloniex on the relationship Steem dollars/Bitcoin (SBD/BTC)
The last two days with 30-minute candles and Bollinger band.
where you see that when you touch the top Bollinger band begins to change the trend

Here I show a picture of Poloniex on the relationship Bitcoin / dollar trade (BTC/USDT)
The last two days with 15-minute candles and Bollinger band.
Where you can see that when you touch the top Bollinger band then start to change the trend.
Similarly when you touch the bottom Bollinger band begins to change the trend

Until here I arrive with this post, I hope you like it.
I hope it helps to understand the subject.
References.
http://www.hotcandlestick.com/
http://www.daytradersbulletin.com/html/cs1.html
http://www.candlestickchart.com/glossary.html
http://www.rightline.net/charts/candlestick.html
http://www.stockta.com/cgi-bin/school.pl?page=candle
http://opcionesbinariasendirecto.com/wp-content/uploads/2014/01/Interpretacion_Velas_Japonesas.pdf
https://es.wikipedia.org/wiki/Velas_japonesas#An%C3%A1lisis_del_patr%C3%B3n_de_velas
https://opcionesbinariasestrategiastrading.com/estrategia-de-60-segundos-para-opciones-binarias/
http://bolsaydatos.com/algunos-recursos-sobre-velas.html
http://www.getpipsystem.com/las-velas-japonesas/
http://estrategiasparanoperder.com/velas-japonesas/
https://en.wikipedia.org/wiki/Bollinger_Bands
http://forextraininggroup.com/profitable-bollinger-band-trading-strategies-for-fx-markets/
http://globaltrendtraders.com/technical-analysis/technical-analysis-of-stock-trends-1-chart-types/
https://www.investopedia.com/articles/technical/02/121702.asp
"Beyond the Candles"-Steve's-
YOU ARE REALLY GOOD AT THIS MAN
That's a world. I'm just learning, thank you very much @monjan