(4/3/18) BTCUSD - Big Picture
Here is a big picture point and figure view of BTC over the past couple of months:
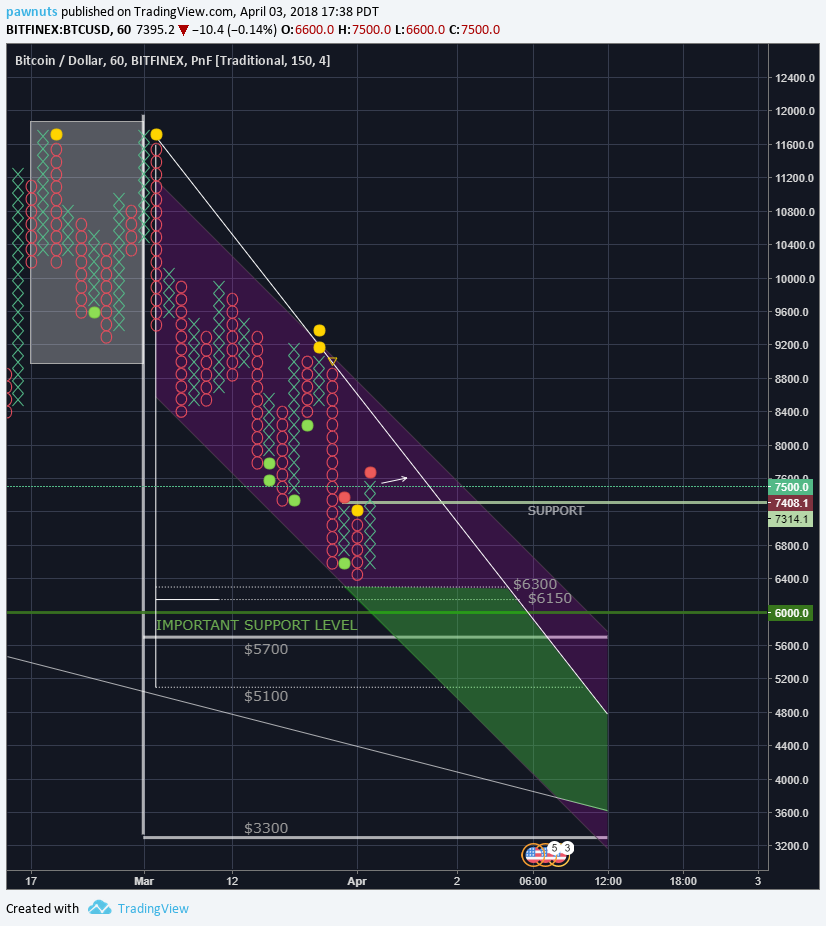
I identified congestion between 10k and 11k to do a horizontal count on but since there was a lot of divergence I think you should take the price projection with a grain of salt. A range of $3300 - $5700 was produced with this count. The vertical count I believe has produced a much more accurate projection at $5100 - $6150.
I believe BTC will move upwards and sideways from here to the trend line before coming down to test $6000 in the coming weeks. Once resistance is met and confirmed the savvy trader should consider shorting BTC as in the past with this channel testing resistance has been followed by a sharp fall in price.
Interesting, but I think the timing of the selling of Mt. Gox bitcoins could really be the big factor. Charts are great when supply is stable and other factros are held constant, but do a poor job of accounting for fundamental shocks. I think Mt. Gox counts as one of those shocks. Now there have been reports that they were not going to sell for a while, but there have also been reports they are moving them. (from the blockchain action.) https://steemit.com/bitcoin/@cryptick/mt-gox-bitcoins-hit-prices
I agree TA is not a magic ball that can tell the future. I have just noticed people seem to spend a lot of time peering over charts that have a time dimension that can distort certain indicators, for example, support and resistance. My mission here is to provide analysis of crypto without respect to time to give traders another perspective or clues they can use to be more successful in their trades.