2025 EOY/Q4 Inflation Review: Finally past the Q1 inflation tsunami and into an unanticipated burn season
Well, unfortunately, this quarter is almost like starting over since we lost the historical data that I have been using from SteemDB. I created some new graphs, starting in October, but there's going to be a disconnect. For 2025 historical data, see Q1, Q2, and Q3.
In Q3, I speculated that the last echoes of the inflation tsunami that we encountered during Q1 had faded, and that seems to have been correct. Additionally, unanticipated in the Q3 article, we have now had two burn proposals approved. Proposal #116 burned 35K SBDs per day during November, and Proposal #117 just launched yesterday to burn 10K SBDs per day as a mix of STEEM and SBDs until June 26.
The good news about starting over is that I put some new charts and visuals into Google Sheets with daily updates, and anyone can now access them here. You don't need to wait for me to post to see some of the numbers and visuals. The bad news is that I can't give a quarterly number for the current inflation rate.
The best I can do is 30 days, during which the inflation rate was 5.93% vs. 5.71% expected. Compare this to Q3 with 8.35% for 90 days, and 6.31% for 30 days.
In terms of new STEEM per day: For Q3, I suspected that we had reached a new peak at 93,294 on July 26, and the September 25 value was 93,184. That peak still seems to be holding with today's value of 92,884 (December 27).
Now, on to the details.
1. Here's what would be expected for the next few months, based on current values (subject to change from known and unknown factors):
If proposal #117 stays funded, I'd expect these numbers to shrink.
| Date | Block # | Inflation Rate | Supply | New Steem/Day | Haircut Supply | Haircut Steem/Day | Lower Bound Supply | Lower Bound Steem/Day |
|---|---|---|---|---|---|---|---|---|
| Jan 2, 2026 | 102,250,000 | 5.69% | 595,648,473 | 92,855 | 595,650,949 | 92,856 | 536,085,854 | 83,570 |
| Jan 10, 2026 | 102,500,000 | 5.68% | 596,454,350 | 92,818 | 596,456,829 | 92,818 | 536,811,146 | 83,536 |
| Jan 19, 2026 | 102,750,000 | 5.67% | 597,259,897 | 92,779 | 597,262,379 | 92,780 | 537,536,141 | 83,502 |
| Jan 28, 2026 | 103,000,000 | 5.66% | 598,065,109 | 92,741 | 598,067,595 | 92,741 | 538,260,836 | 83,467 |
| Feb 5, 2026 | 103,250,000 | 5.65% | 598,869,983 | 92,701 | 598,872,472 | 92,702 | 538,985,225 | 83,431 |
| Feb 14, 2026 | 103,500,000 | 5.64% | 599,674,514 | 92,662 | 599,677,007 | 92,662 | 539,709,306 | 83,396 |
| Feb 23, 2026 | 103,750,000 | 5.63% | 600,478,698 | 92,621 | 600,481,194 | 92,622 | 540,433,074 | 83,359 |
| Mar 3, 2026 | 104,000,000 | 5.62% | 601,282,530 | 92,581 | 601,285,029 | 92,581 | 541,156,526 | 83,323 |
| Mar 12, 2026 | 104,250,000 | 5.61% | 602,086,006 | 92,539 | 602,088,509 | 92,540 | 541,879,658 | 83,286 |
At present, we're in the neighborhood of 4/10 of a percent off the July peak. In March, we'd expect to be 8/10 of a percent below the peak.
2. And here's what the full visualizations of expected new STEEM per day look like (also subject to change from known and unknown factors):
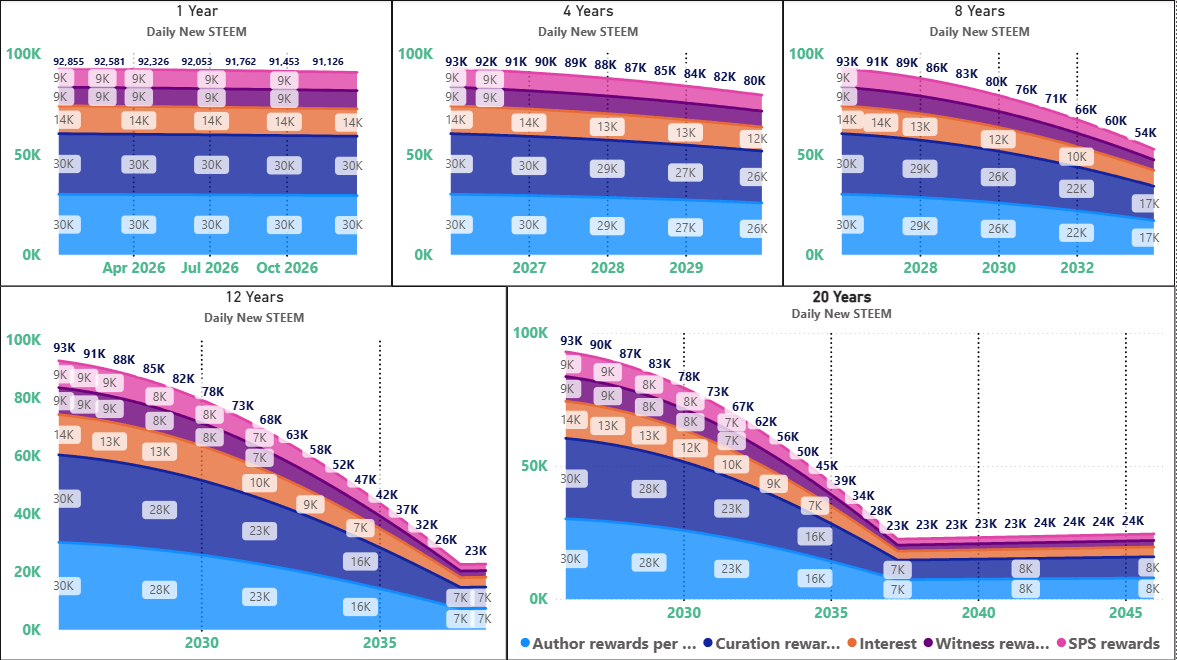
All of this is unchanged from Q3:
This would put us at the December, 2024 level (88,823 STEEM per day) again in September, 2027, and it would put us at the November, 2023 peak (89,913) in May, 2027. So, it looks like the overall time cost from the Upbit delisting and subsequent conversion activity is now estimated at about 3 1/2 years.
3. Here's a forward looking visual with projections for daily new STEEM, expected virtual supply, and the blockchain inflation rate with upper and lower values, depending upon the price of STEEM in comparison to the haircut ratio.
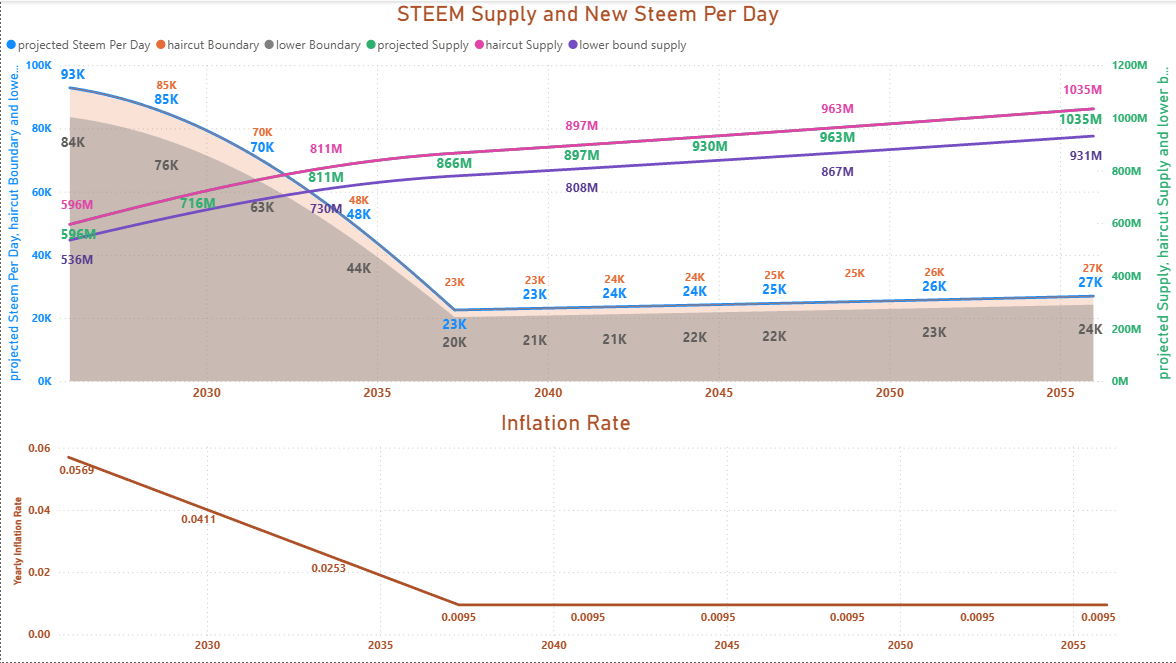
The price of STEEM is still below the haircut price, so we're still riding the upper boundaries of the curves. If the STEEM price rises above the haircut price, it would move things towards the lower boundaries.
Supplemental
Before moving on to the backward looking numbers, I want to revisit the notion of Five phases of Steem inflation. Back in 2023, I imagined Steem inflation in five phases:
- Before hardfork 16 (not visualized here)
- Hardfork 16 to 2021 - A time when daily new STEEM creation was increasing with decelerating momentum
- 2022 to 2026 - A time when daily STEEM creation is basically flat
- 2026 to 2037 - A time when daily STEEM creation is decreasing with accelerating momentum
- 2037 and forward - A time when daily STEEM creation grows steadily and smoothly
The curve is pictured here:
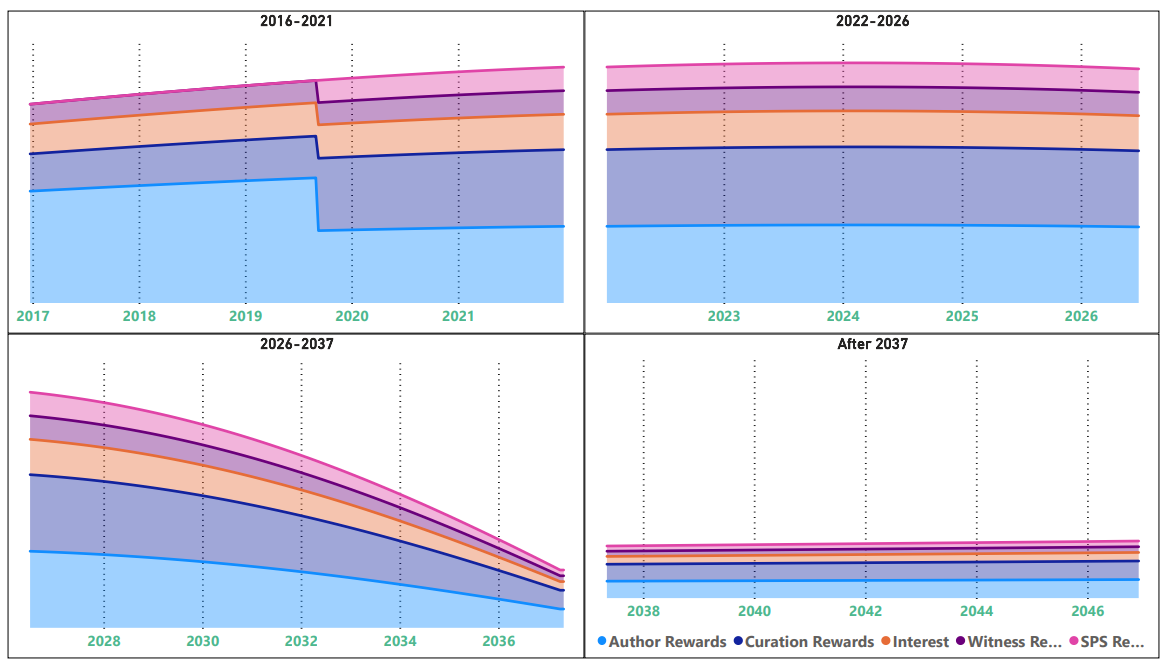
The dividing-years were arbitrary, but as 2025 comes to a close, it's worth noting that 2026 was a transition year under that delineation. Basically, what we would expect over the next 12 years is the equivalent of two reward halvings. This leads me to suspect two things:
- As the daily rewards distribution shrinks, future market behavior may diverge, increasingly, from the behaviors that we've seen in the past; and
- Any burning that happens now will be amplified by the upcoming inflation curve.
Now, let's take a look backwards
Since I lost the historical data from SteemDB, I can only go as far as October. Here's what we can see:
STEEM and SBD supply numbers
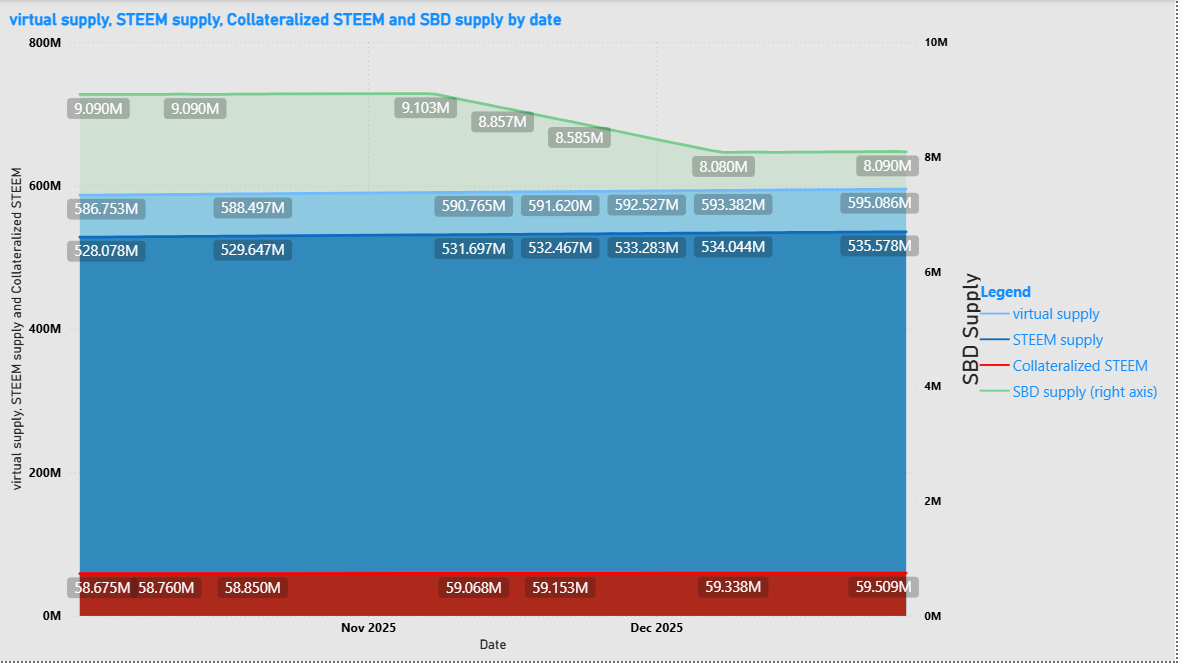
The effect of proposal #116 is quite apparent on the SBD supply during November.
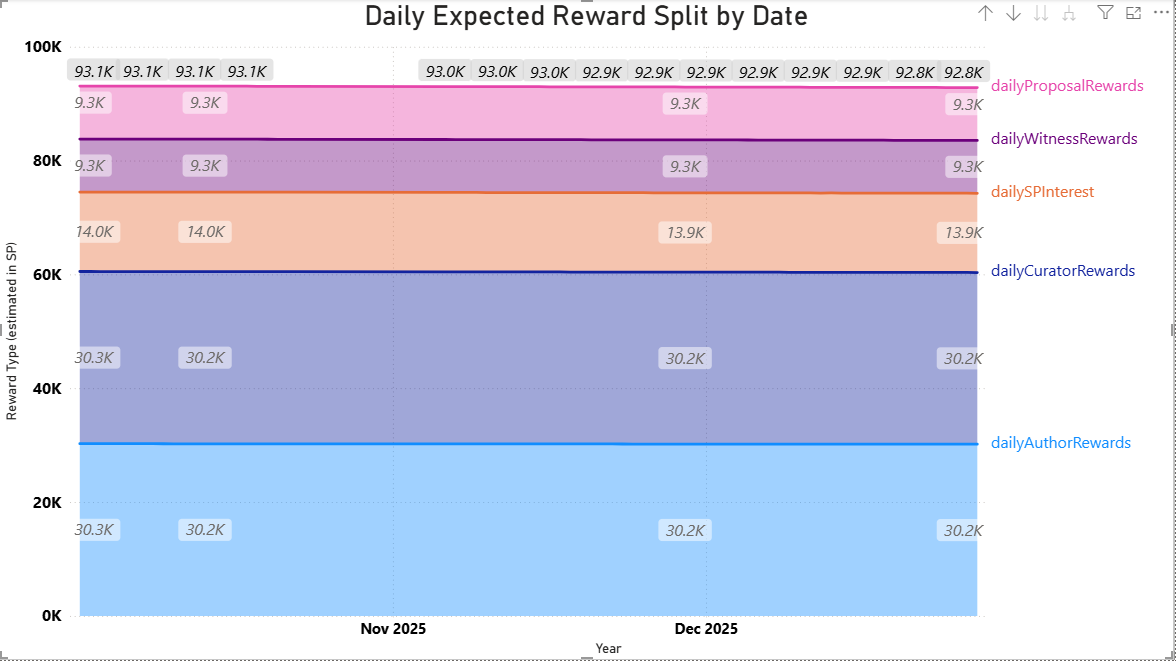
Daily reward distributions
This isn't something I've tracked before, but since I was updating the visuals anyway....
And some other stuff from here
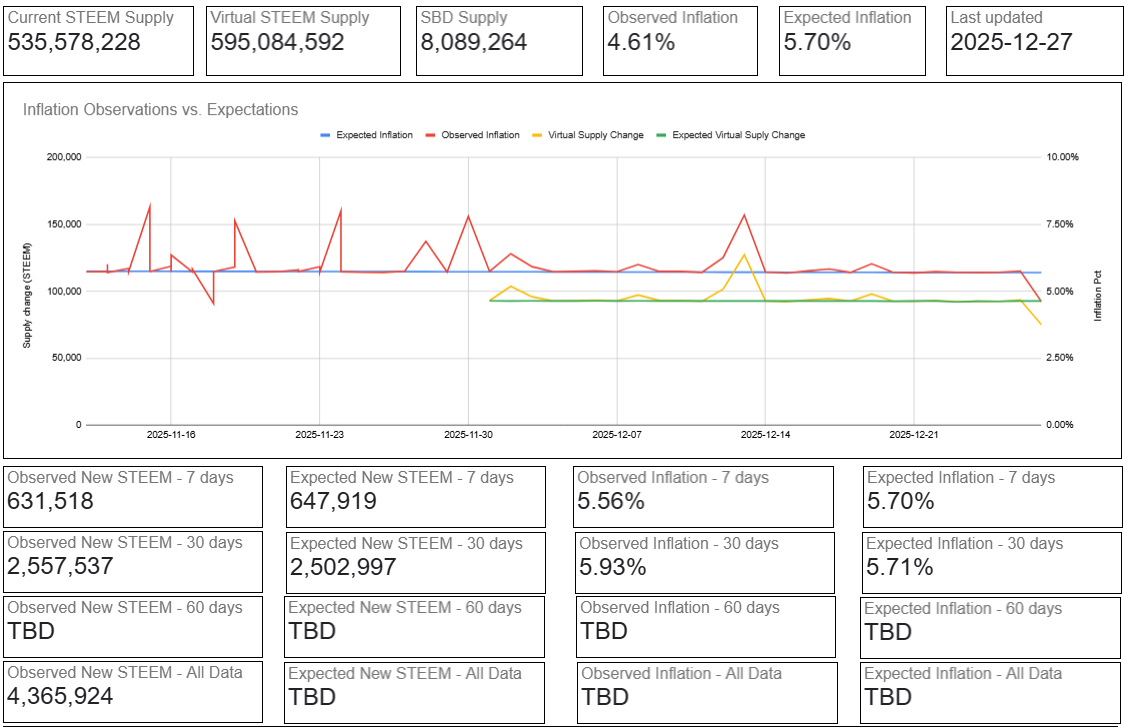
We can see that inflation has been tracking expectations pretty well after November, and we can also see the very first dip from proposal #117.
Cautionary note (repeated from previous posts)
It's important to remember that these projections can all change, depending upon known and unknown factors. Known factors:
- Burning STEEM and/or SBD can reduce inflation
- If the STEEM price goes above the SBD print threshold, that will reduce inflation
- Witnesses can decide to start paying interest on SBDs, which could increase or decrease inflation - depending on the price of STEEM relative to the haircut threshold and on how/if interest payments influence SBD conversion behavior.
- If the STEEM price goes above the SBD print threshold, additional price movements can either increase or decrease inflation - depending upon direction of change.
- Missed blocks by witnesses can reduce inflation
- Witnesses can change any settings they choose in a hard fork, which could have any conceivable result.
- SBD conversions increase inflation when the price of STEEM is below the haircut threshold.
- There may be mistakes in these reports or other factors that I'm presently forgetting or not yet aware of.
Conclusion
Overall, this quarter reinforced some suppositions from last quarter, namely that (1.) the daily STEEM production peaked in July, 2025; and (2.) that the last waves of inflation from the Upbit delisting are probably behind us. In addition, some unanticipated burn activity began this month in the form of proposal 116 and proposal 117. It will be interesting to see how this develops in 2026.
Overall, actual inflation this quarter appears to have tracked fairly well against expected inflation, but due to the loss of historical data from SteemDB, we don't have the exact figures.
Finally, as 2025 comes to a close, we may be entering a sort of transition year as a result of the inflation curve. Until now, daily rewards have been increasing or flat. Starting in 2026, the daily rewards will be decreasing, and they will decrease faster every year until 2037. This works out to be the equivalent of about 2 reward-halvings in a 12 year period. It will also be interesting to see how this affects market behavior in the future.