ETH prices about to CRASH!!!
Over the past few weeks, we have seen the price of ETH go parabolic. Anytime the price goes parabolic, the price will always experience a substantial correction. The question is not whether it will crash - it definitely will crash - but when is the peak. There are several signs that this is the top.
.png)
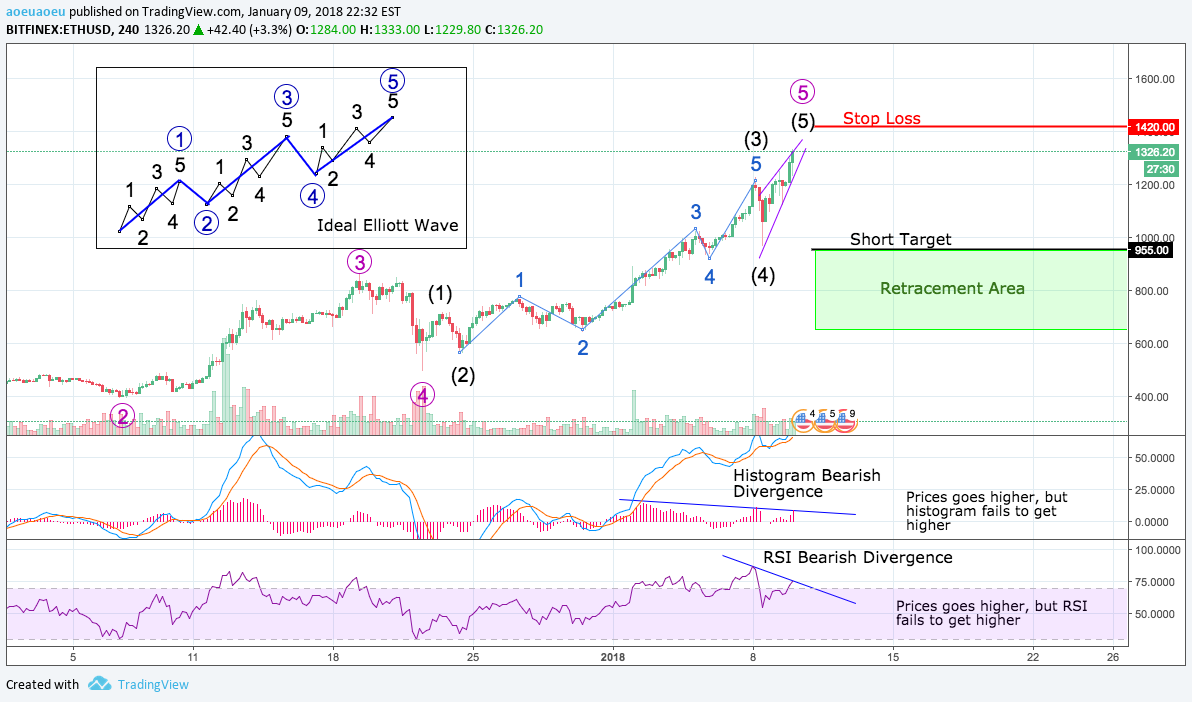
Bearish Divergence on MACD and RSI
The prices are rising higher, but the histogram and the RSI fail to increase. This means the trend is losing momentum; the price just isn't increasing as fast previous upticks (when you zoom in and look at the last 20 or so candles). It could indicate that there isn't enough future buyers to sustain the same price growth. And without enough buyers, the price plummets.Rising Wedge Forming
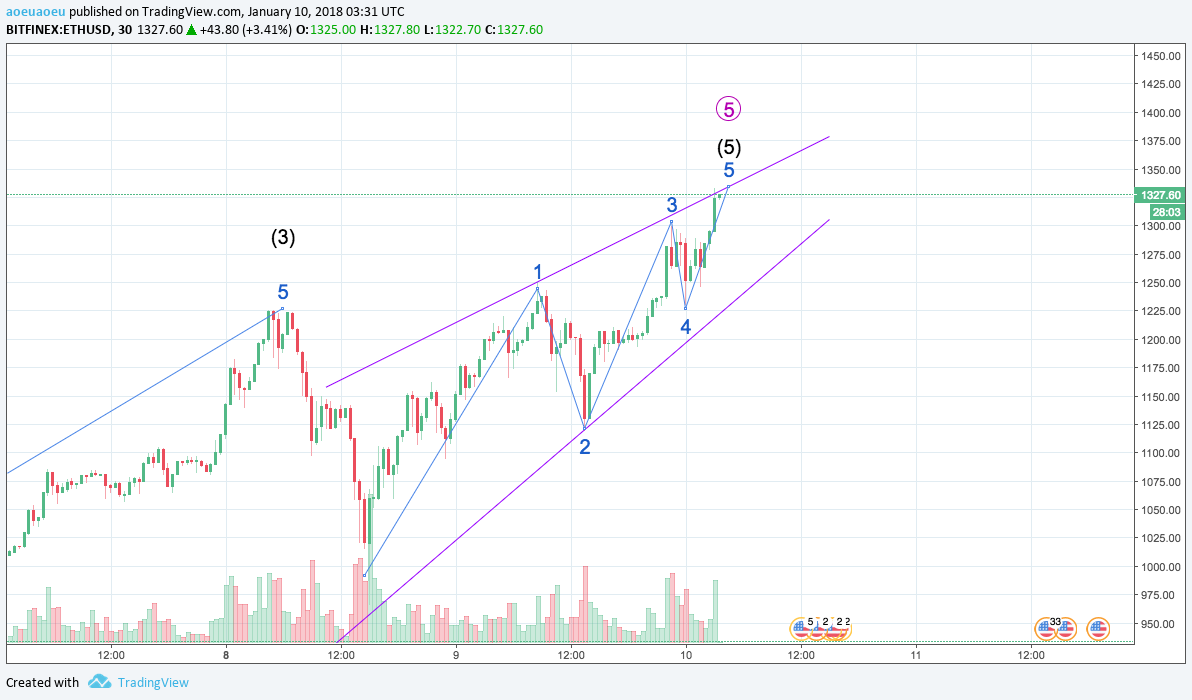
In the last day and a half, the price has been forming a rising wedge. The prices seem to be squeezed in an upward triangle (purple lines). Although the prices are rising, the resistance line is rising slower than the support line, indicating that the bulls are struggling to push the price higher since the prices are climbing slower and slower. The bears have shown strong resistance and will soon take over once the support line breaks.5 Elliott Waves completed
Uptrends tend to travel upwards in 5 waves. 3 of the waves go up (impulse wave), and 2 of the waves go down (corrective wave). Waves 1, 3, and 5 are impulse waves, while waves 2 and 4 are corrective waves. Each impulse wave can be divided into 5 subwaves. After the five waves a correction occurs, the price usually retraces between 38.2% to 61.8% of the 5 waves combined. The percentages come from Fibonacci ratios that commonly occur in nature (and in the prices).
I have drawn out the Elliott Waves, and ETH just completed or is almost done the five waves. Note that subwave 3 was extended.That means we will retrace 38.2% to 61.8% or down to the $650 to $950 range.
.png)
We have also completed the 5 sub-subwaves within the 5 subwave.
What if this analysis is wrong?
We are never certain in trading, and I could wrong. Perhaps, Ethereum will experience only a minuscule correction before skyrocketing to the moon. It may develop an extended fifth wave. That is why I set stop losses. However, with these signs, I think that a crash is the most probable course of action. In trading, we trade based on probability, not certainty. Most similar setups in the past have led to a crash. cough Bitcoin to $20,000 cough Litecoin to $330 cough
Conclusion
A temporary top for Ethereum is definitely near. If Ethereum doesn't drop within the next day or so, it will eventually collaspe in the following days. The price has simply gone up too quickly too fast. It's better to not be greedy and buy back during the dips.
For daring and adventurous traders, I have outlined a short setup with the target and the stop. Please note that this is very risky as we are still in the uptrend for the time being.
Disclaimer: This is just my opinion, not financial advise.
If this has helped you, please share, upvote and resteem.