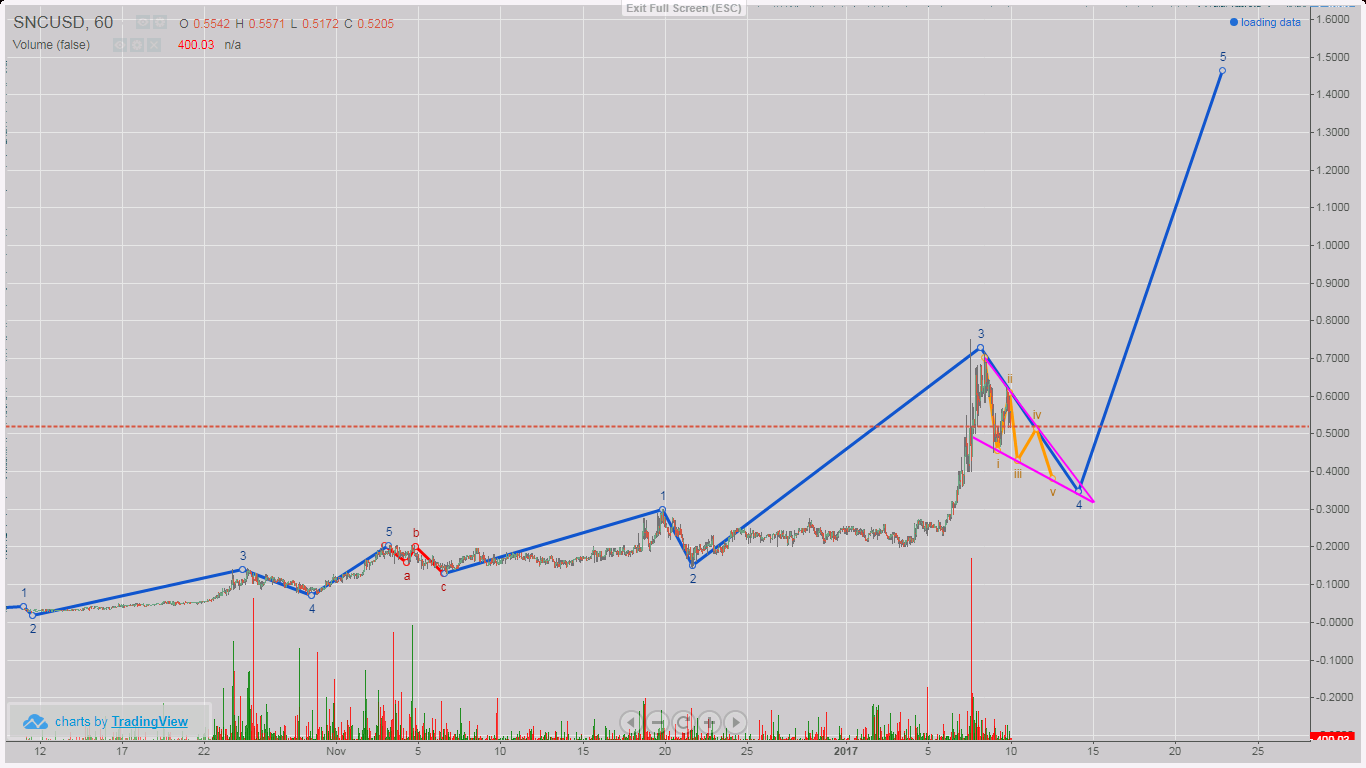
SunContract (SNC) Bullish 5th WAVE to come?
SNC looks to be in the middle of a bullish triangle correction in a 4. Elliot Wave.
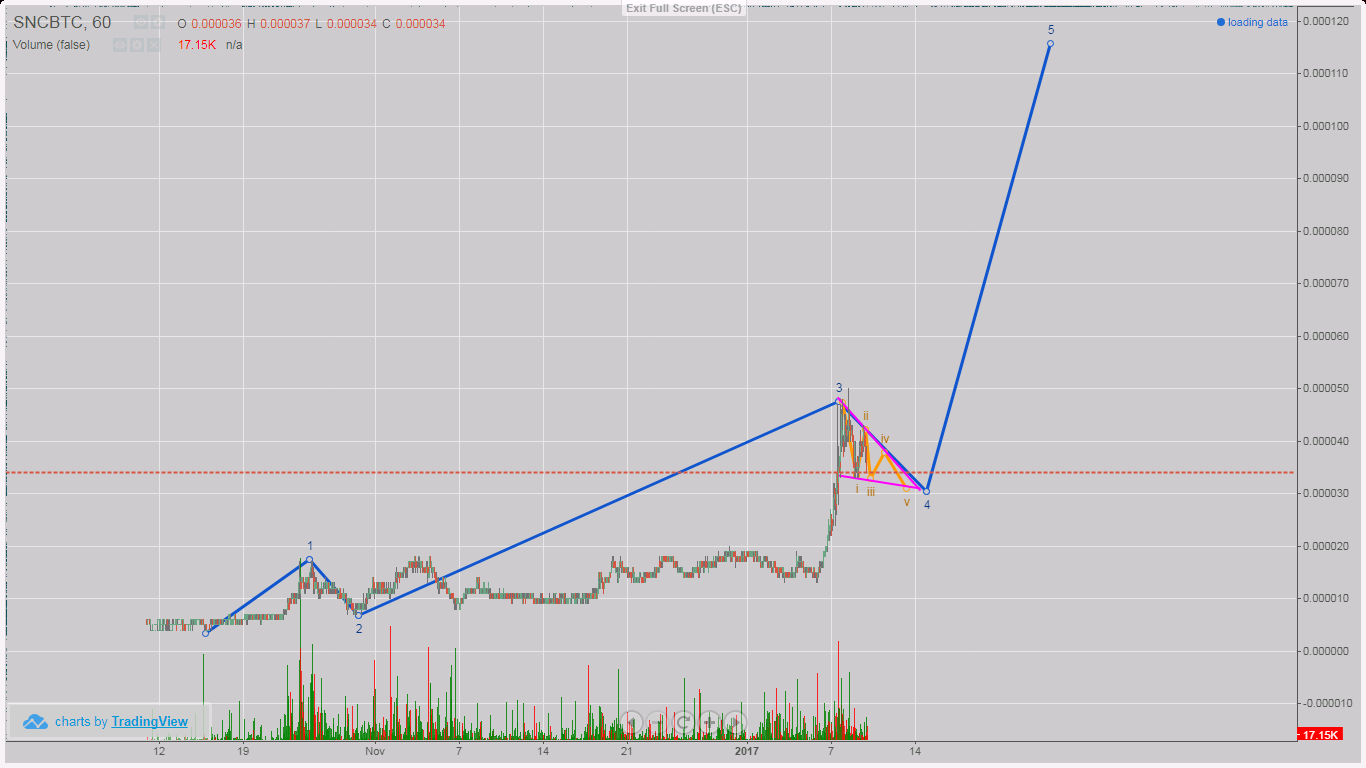
It could play out like this,
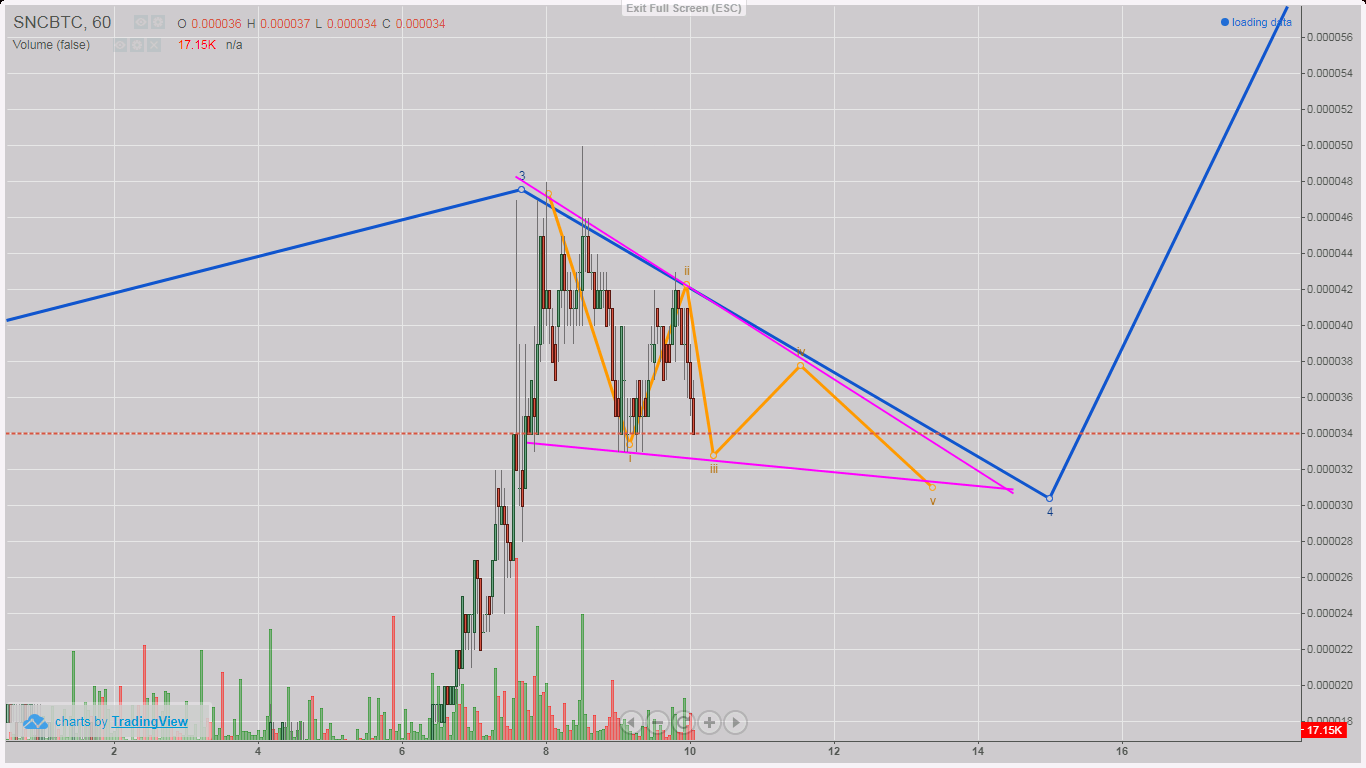
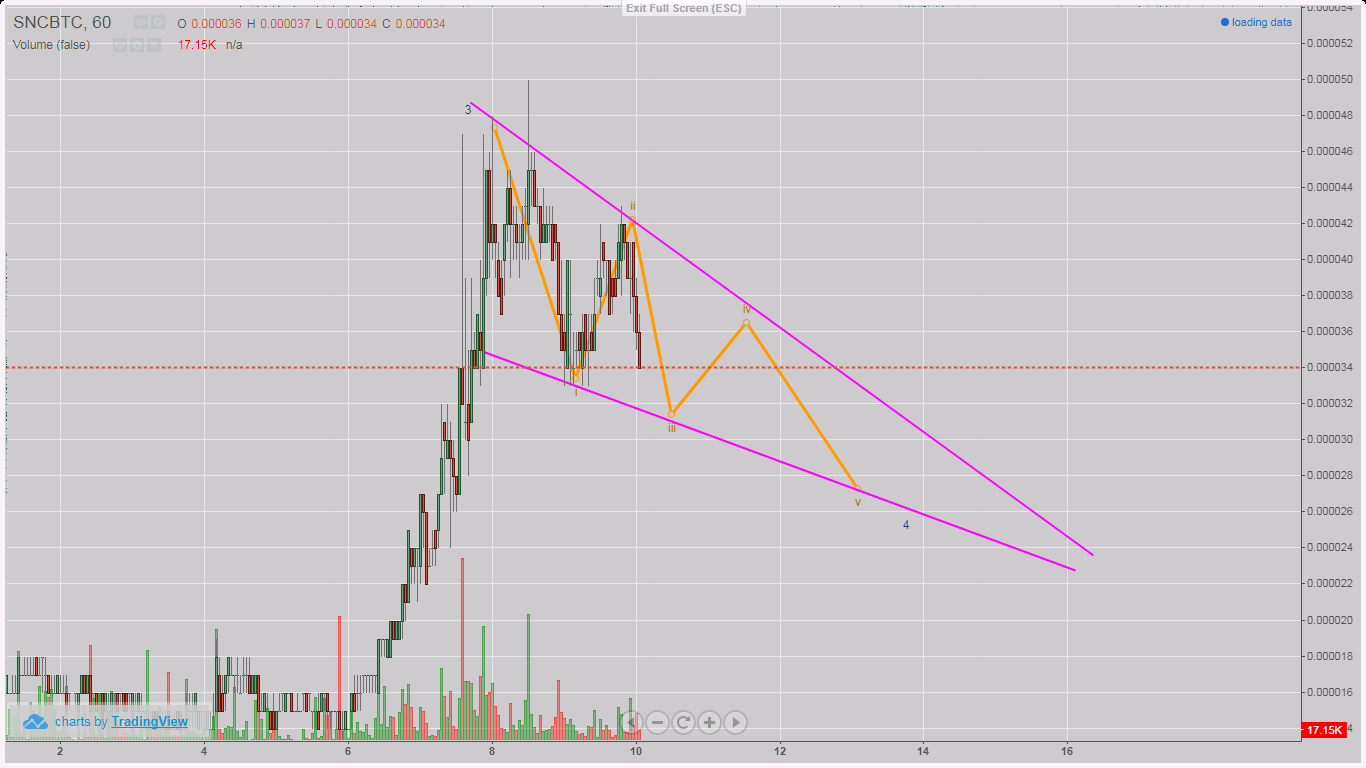
Or even more down like this one:
Target still should be around 0.000115 BTC or more!
SNC/USD looks just as bullish! 4. wave should make a triangle like this one
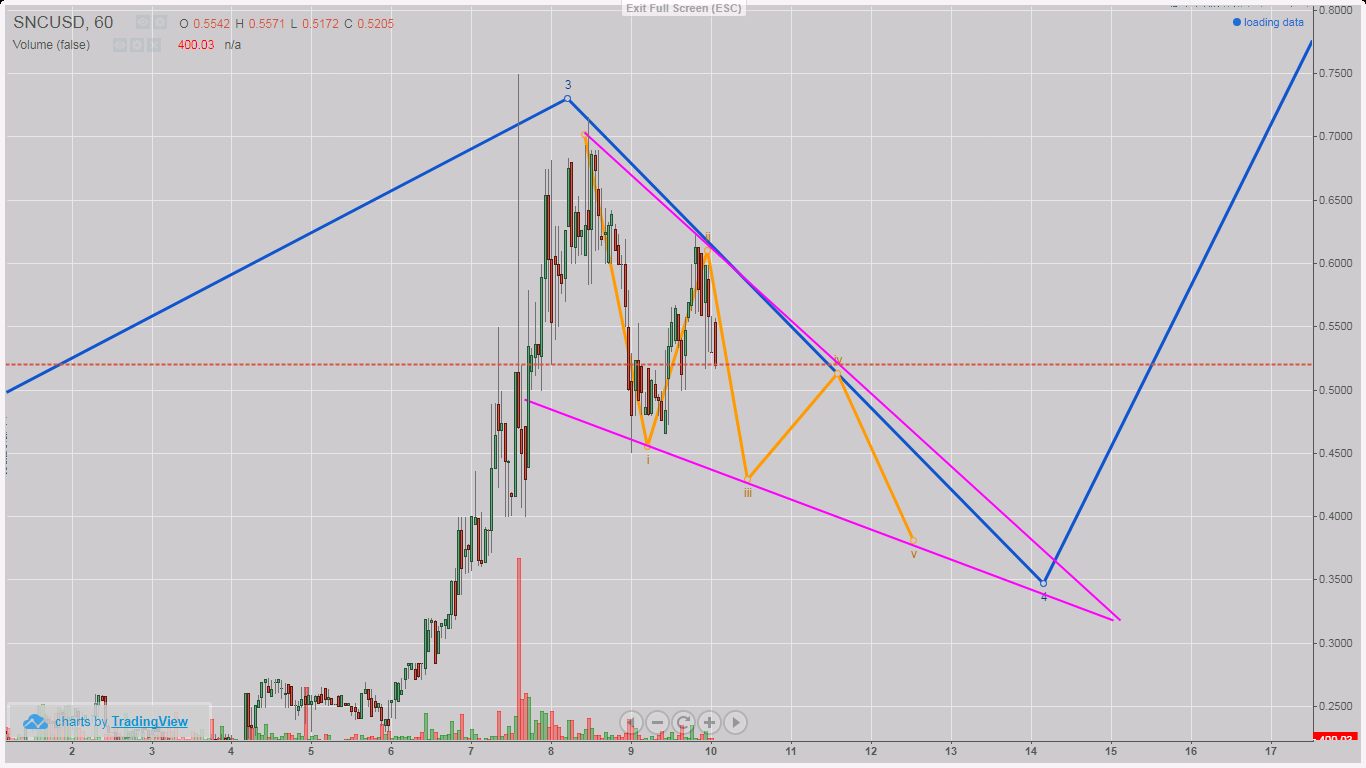
Target would be $1.45 or more!

Comments are highly appreciated, and if you profit from this chart, or enjoy my post, please upvote, resteem and follow!
I have learned this profitable EW charting by @haejin btw!
These charts are done at Hitbtc exchange .
If you feel like buying me a beer:
ETH: 0x478c06b33f2b03892dcbb03cd353defba356bc26
LTC: LQ3Jc2bq46Dc8FBkdDoDKtAtYp6mNdLDSa
BTC: 1NXnrq9WcF2BoL2dwAgNg85MZ2qiwN5e1j
BCH: 1GTzQYiTn2EqNt3YVp9LoCbzVvouHiHJAD
Great information, Thanks for taking the time to share I'll definitely look into SNC more. Just gotta be worrisome about the past red day but prices should correct up soon
Sharing it make me more aware, and I get valueable inputs as well. I learned this because @haejin shares his wealth of knowledge
I think, alternatively, where you put end of the wave 3 at 0,7 USD can be actually end of wave 5. And after this correction can start a new cycle.
But I spent a few hours today looking at this chart. And what you done here seems more reasonable as what I came up with. So, now I am bit confused about SNC.
Did you count the subwaves?
If you look at the SNC/USD chart I counted the preceeding waves from the absolute bottom. This cycle should have the 5. wave remaining, and this cycle draws up to be the second wave of an even greater cycle.
In my opinion :)
I did. I used 15m chart to look for subwaves. It was a bit tight when it comes to 4 not overlapping with 1, but it passed. I guess it is bcs strange pricing at HitBTC SNC/BTC pair... I cannot post the chart now, I can't with phone. I can post it in few hours.
Also another thing, I checked HitBTC now, and I think this correction might go more of 5-3-5 than triangle. But I am not sure if it makes any difference.
Probably the outcome will be more or less the same. Seems most coins are cheaper on Hitbtc, a little different sentiment than on the main exchanges.
So this is my chart. I started the wave one after initial downtrend of SNC ended. And don't mind the right side, of the chart, my first try to understand that correction failed hard. I was way too optimistic :D
And I think most deforming thing is that you can put only minumum of 100 satoshi as a price in SNC/BTC pair. So the price jumps 100 points like crazy.
And this is alternate zig - zag correction. As of now, it seems legit when I look where SNC/USD had moved.
The funy thing is, I think even thou we did chart in diferrent way, target is basicaly the same. I would also guess around 1,4 USD.
I think the first wave from lowest low happened 24-28 october, a month earlier than your 1. Divided in two cycles and a correction like I did you can zoom out and you see the cycles forming 1. and 3. waves of a greater cycle. This means even more profits after our target is reached.
Yes, there is many ways to rome obviously :)
Actually, I also started 23rd october. But 1 hour chart didn't loaded that far in history, so i just started wave 1 at price from that date. In the end, it is about the price step and time is not important. (I think I learned that from on of your comments.) Definitely where the downtrend of initial listing ended.
Many ways to Rome, yes :D
And a lot to learn for me.
Thanks!
I usually start in 1day chart, draw the waves as I see them there. Then zoom to 4 or 1h and count the subwaves to confirm or correct the greater waves.
We both got a lot to learn, but sharing and discussing is like learning in fast lane :)