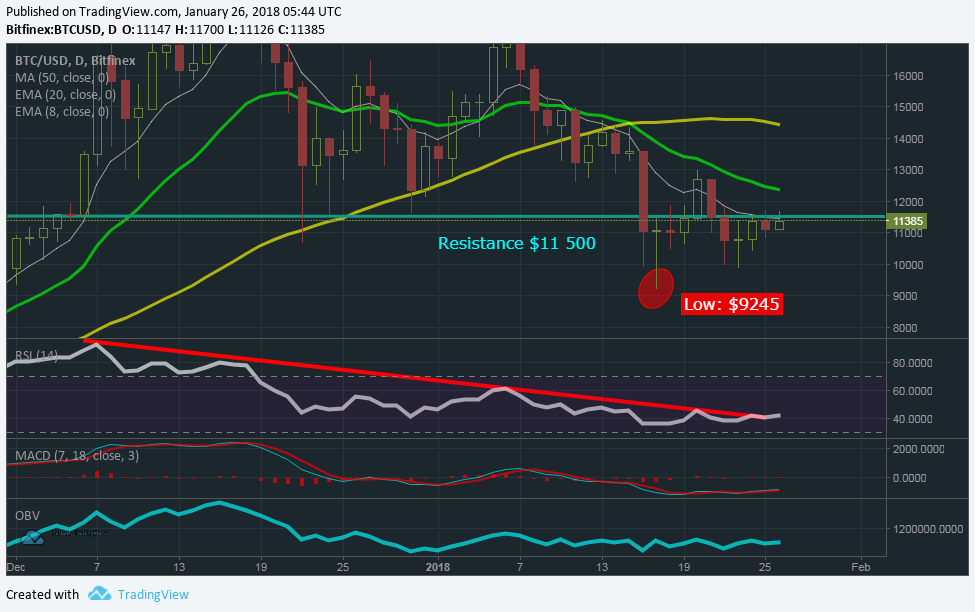
Bitcoin & Altcoin Price Analysis 26 Jan
Cryptocurrencies and blockchain have taken centre stage at the World Economic Forum in Davos, over the past few days. Regulators, politicians and well-connected businessmen are all scrambling to get their heads around this new asset class. Regulation and taxation of cryptocurrencies are no doubt the primary concerns of the attendees at Davos, but the price has remained relatively stable over the last 4 days, signalling to me that we may be forming a bottom.
Be that as it may, should we see a break to the downside, I am still watching the development of the bullish Gartley pattern I highlighted a few days back. I am watching for price to come down into the green box at the “D” point. If it does this, then we could see an upmove to the “C” and “A” levels.
However, the technical indicators are slowly turning and starting to show some optimism. BTC has been finding resistance at the $11 500 level for the last 6 days, but volatility has been decreasing. We are seeing the formation of an ascending triangle (upper resistance at a price level, with a series of higher lows forming), and may see a break to the upside. The RSI has broken through the downwards trendline, and the MacD has formed a bottom and started to turn. On Balance Volume still remains relatively flat.

The January Bitcoin futures contract expires today, and if we are going to see any price manipulation by Wall Street we are most likely to see it a few hours before the market closes, this will be around 4pm GMT. So I’m on the lookout for a price drop this afternoon to see if there is any evidence to support the manipulation hypothesis.
The altcoin market has been performing reasonably well over the last 5 days, gaining strength of the stabilization of the BTC price. However, when pricing alts in Bitcoin, you can see a more true representation of value. Over the last 5 days, the only large-cap alts to gain ground when priced in Bitcoin are EOS, NEO and Ethereum. Everything below the black line has lost value when priced in BTC. The chart looks very different when priced in USD, but that is misleading, as most alts are purchased using BTC.

EOS remains a strong contended in the altcoin space, as do NEO and ETH. What is interesting is that these are all smart-contracting/Dapp platforms. This gives some support to my hypothesis that this space is growing faster than most other crypto related industries.

Coins mentioned in post:
Interesting analysis though I'm not normally into subjective TA but always curious what people think. Short term I'm bullish on BTC (and long term but it will have its ups and downs) as seen from my data below. Check this out if it interests you: https://steemit.com/steem/@weilii/introducing-the-neux-oracle-steem-and-bitcoin-trade-signals Just started following you, would appreciate a follow back if my price analysis content interests you as well :)
thanks man, I'll give your work a read!