PREDICTING ELECTIONS USING TWITTER AND POLLS
1. OVERVIEW
In this work, we treat users’ voting intentions as time-variant features. Instead of trying to predict every user’s vote, we treat Twitter political discussions as a general index that varies with time; we define several Twitterbased features and fit them in time-series models, using opinion polls as our ground truth. In this way, we combine the Twitter-based time series with the poll-based ones.
2. METODOLOGY
Approaching our problem as a multivariate time-series forecasting task for each country separately, we created time series of 11 Twitter- and one poll-based feature for every party. An example is the number of tweets mentioning a certain party on a specific day (Twitterbased) and the percentage of that party reported on a poll that was conducted on that day (poll-based). Next, we provided all these features as input to different forecasting algorithms to predict every party’s voting share separately.
3. DATA AGGREGATION AND MODELING
3.1 Data Aggregation
Using the public Twitter Streaming API (https://dev.twitter.com), we aggregated tweets written in the respective language that contained a party’s name, its abbreviation, its Twitter account name, and some possible misspellings (such as grunen instead of grünen). We excluded several ambiguous keywords to reduce noise (for example, the abbreviation of the Dutch party “GL” could stand for “good luck”), which might slightly affect the replication of naïve counting-based methods.
3.2 Modeling
The extracted several Twitter-based features that potentially disclose users’ voting intentions. These features were based on past works, showing that the counts of a political party on Twitter and the expressed sentiment toward it are to some extent related to its voting share in elections. However, instead of relying strictly on counting-based methods, we incorporated daily features into time series to correlate them to the opinion polls (discussed next). Working on every country separately, we first assigned equal weights to all parties mentioned in a tweet,so that they summed up to one.
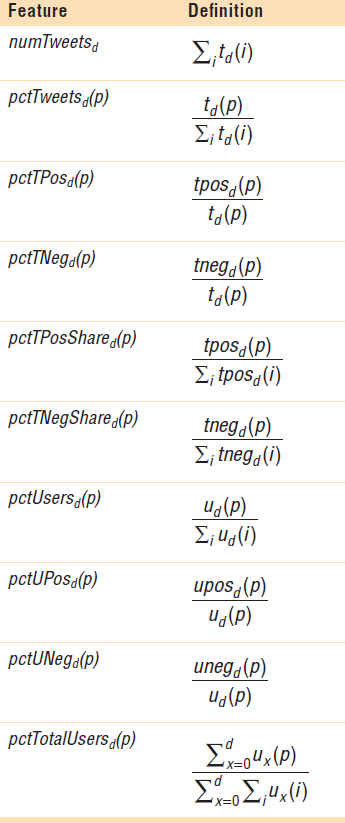
Let td(p) denote the (weighted) number of tweets that mention party p on day d and tposd(p) (tnegd(p)) the corresponding number of tweets containing positive (negative) content. Similarly, let ud(p) denote the number of users mentioning party p on day d and uposd(p) (unegd(p)) the number of users who have published a tweet with positive (negative) content about party p on that day. We constructed
the features in Table 1 for every day.Here, pctTotalUsersd(p) refers to the distinct number of users who have mentioned p, divided by the total number of users up to day d.
4 ALGORITHMS
We tested three different algorithms on each political party separately, using only this specific party’s features ( Twitter- and one poll-based) as input. These algorithms were linear regression, Gaussian process, and sequential minimal optimization for regression, all implemented using Weka with the default settings (our released results included a fourth algorithm, support vector regression; due to its poor Performance in Greece, we didn’t test it on the other countries). Because it was difficult to evaluate each algorithm before the elections, we initially decided to empirically apply a seven-day training window for every algorithm and considered the average predicted percentage for every party as our final estimate.
5 RESULTS
To evaluate both the voting share predictions of the competing methods and the ranking of the parties, we selected the standard mean absolute error (MAE), the mean squared error(MSE), and the tau Kendall coefficient (ta) as our evaluation metrics. Table 3 presents all the results together, along with the average per-country values of our evaluation metrics.
Overall, our TPB model performed the best in both error rate terms. However, it didn’t perform equally well in terms of correct ranking of the parties, following by 0.03 the best competing model (PB) in ta. One possible explanation for this effect is that—a we weren’t interested in correctly ranking the political parties, but instead predicted their voting shares individually only the features related to an individual party were used for its prediction. Using features from different parties to predict each party’s voting share is a challenging task for future research.
6 FUTURE WORK
Future work includes fine-tuning the training window size, incorporating network-based features for the users, using features from different parties, and creating a more accurate method for sentiment analysis. Collecting data from the Facebook pages of the political parties, and we will try to exploit them for the same task. Given that we have enough data for this purpose, we plan to fit a model to the actual results for one country and test it on the others, in an attempt to analyze if generic Twitter-based-only solutions are possible.
Reference
Adam Tsakalidis, Symeon Papadopoulos, Alexandra I. Cristea, Yiannis Kompatsiaris,” Predicting Elections for Multiple Countries Using Twitter and Polls” IEEE Intelligent Systems 2015, Volume: 30, Issue: 2,pg 10-17
Hi! I am a robot. I just upvoted you! I found similar content that readers might be interested in:
http://www.academia.edu/14681886/Predicting_Elections_for_Multiple_Countries_Using_Twitter_and_Polls
I have added the reference to the paper. But this is my report on the paper so it is not plagiarism
Good
I am joining the plagarism report of the above article here
This post has received a 0.28 % upvote from @booster thanks to: @pps.
Good work man👍
@pps