Ethereum Price Analysis 1 November
Analysis of the price of Ethereum
Main Highlights
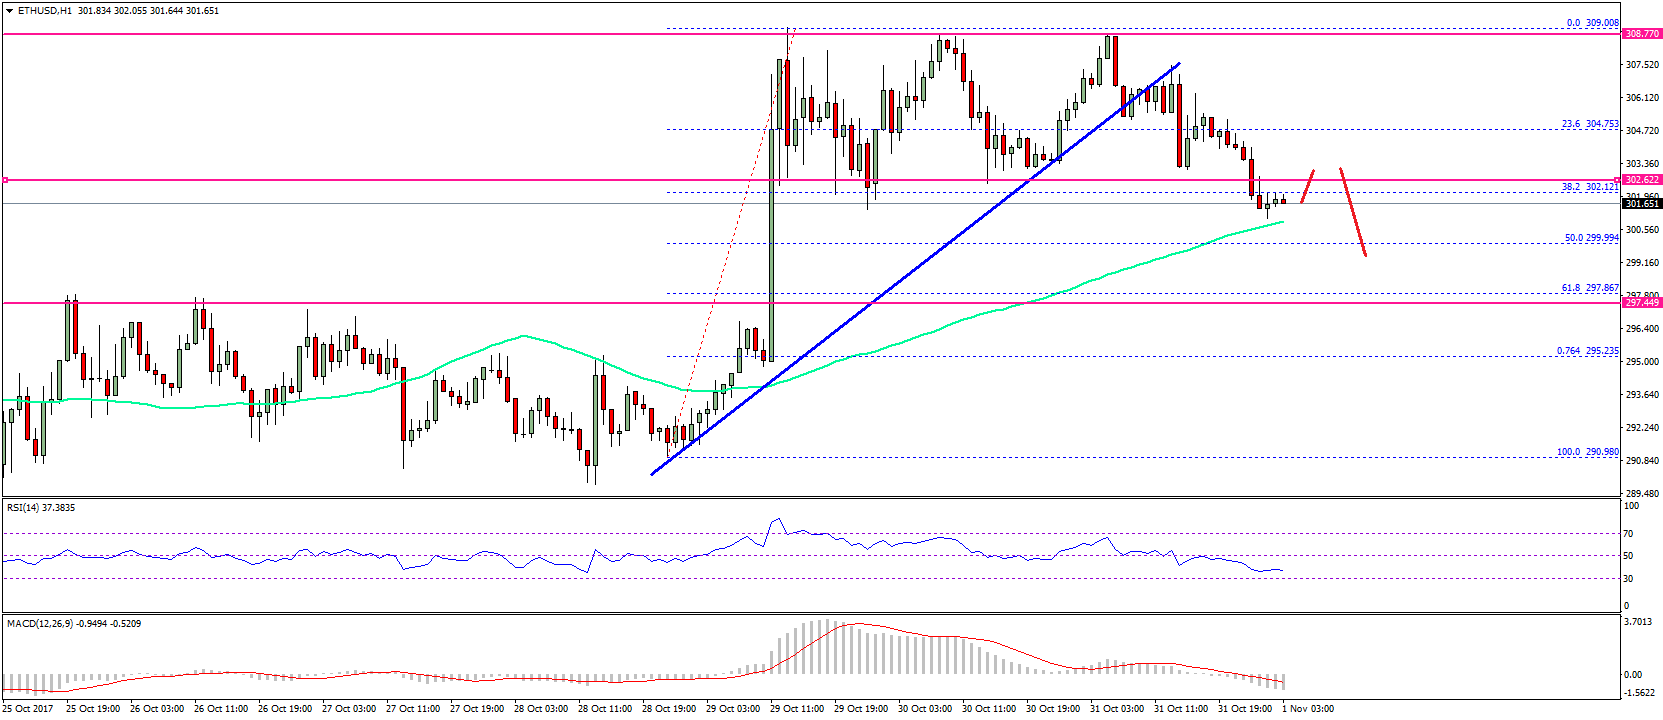
ETH's price failed to hold back and traded at $ 304. Yesterday's short-term upward trend line with $ 305 support was discontinued.
Ethereum's price began to fall again against the US dollar and Bitcoin.
The price of Ethereum
There was no upward pause in the price of ETH above the $ 309 level. The price began to move downwards and broke Fibonacci's correction of 23.6% at the last peak in the price from $ 290.98 to $ 309.08. During the downward movement, there was a short-term upward trend with support of $ 305.
At present, the average value of the 100-hour chart is about $ 300. The next important level of support is about $ 290.98, and this is at 50% Fibonacci correction.
Upwards, the $ 305 level is now a level of resistance. Today, there will be a re-test of $ 309.
Basic maintenance level - $ 299
Basic resistance level - $ 305
Image Source