Ethereum Uptrend Remains Intact | ETHUSD
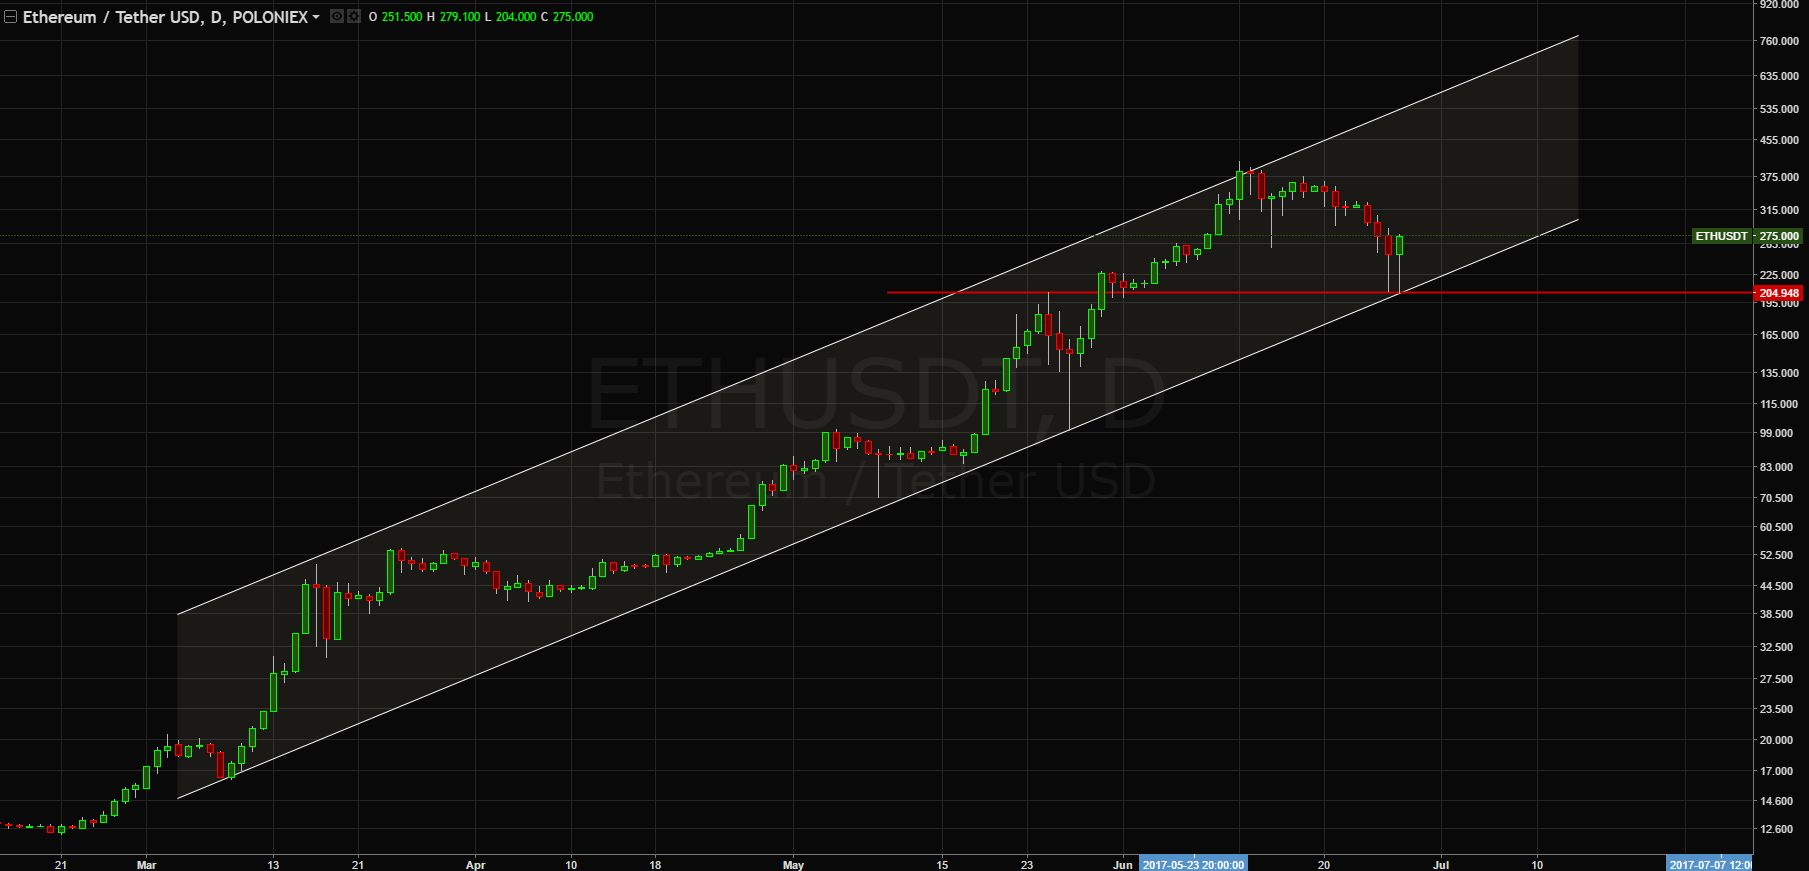
Ethereum has been retracing for the last 14 days bringing the price down from the high of $408 down to $204. The fear in the market is palpable with many people, and even the most optimistic Ethereum investors calling the correction, the "bubble pop" on the crypto space.
Ethereum retraced and has found support at the $205 handle which neatly coincides with Ethereum's channel support and a fibonacci level of 61.8. If the support remains strong for the remaining of the week we may see Ethereum take out its previous highs and set its sights on $1000 before we have a main correction again.
Also, since we're dealing with parabolic moves, visiting Ether's price on the logarithmic scale isn't such a bad idea.

Ethereum Technical Analysis : Bullish with major Resistance at $320
https://steemit.com/ethereum/@aqfaridi/ethereum-technical-analysis-bullish-with-major-resistance-at-usd320
Yep, It's a real test. Not only do we have the channel you've drawn but a fib level 78.6 + ema200 resistance on the hourly TF. We can see some noise in the following hours.

HODL!
Do you really think ethereum will keep skyrocketing?? I have reason to believe that it has the most to lose same with ripple because of the exponential growth out of nowhere basically.
Do you consider Ethereum expensive at $290?
Then what do you think of Byteball that trades at $768.59.
We had a retrace of 61.8, pretty normal, and the fear was palpable at $200. Many people were thinking of cashing out the Ether and hibernate. I think that one of the best indicators of the crypto market is really sentiment based on social media. When fear is abound, you do take note of it on twitter and youtube. When hype is abound, google trends is your friend as a leading indicator for a price reversal.
Do I think it will keep skyrocketing? Maybe, but I think that the top is not $400 and if the channel maintains, then we will see $1000. On the daily TF, we have hit support with a healthy bounce, so far, it may change though, but if we close today above $260 then the uptrend remains in play.
"Exponential growth out of nowhere basically" ??? Most cryptos have displayed bubble behaviour, exponential moves throughout their history. A couple of exponential moves before hitting $1, a couple times more before hitting $10, and so on, but it never seems to crash completely, this, because if we discard fundamentals and look only at the charts, then know that we're dealing with FRACTAL patterns. It can be highly illusive.

So the more pertinent question is, How much exponential can you get before hitting the true ceiling? And that's a great question indeed. 200k targets aren't out of the question, afterall if we are in a bubble, then know that at the height of tulip mania, 1 tulip would buy you a house by a canal in Amsterdam. That's 1 flower, for a house!
#buythedeep
Now you know why it's hard to buy when the price is right and equally hard to sell when it's toppy.