My personal Chart of Fears
4 periods where the Dow went nowhere, sometimes for decades:
1906–1924 (~18 years)
San Francisco. WWI. Spanish Flu. Two decades of noise, no progress.1929–1954 (~25 years)
The longest drought in market history. The Crash of '29 didn't bottom until '32 — and the Dow didn't reclaim that peak until the mid-1950s. A full generation.1966–1982 (~16 years)
The invisible bear. The Dow oscillated between 600–1,000 for 16 years. Vietnam, Nixon, stagflation, oil embargoes. Real returns were deeply negative once you adjust for inflation.2000–2013 (~13 years)
The "Lost Decade" that was actually 13 years. Tech bust → 9/11 → GFC → European Debt Crisis. The Dow in 2013 sat roughly where it did in 2000.
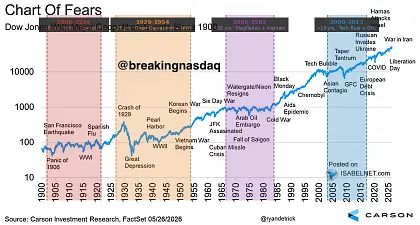
Total: 72 years of the last 126 spent going sideways.
The chart looks like a rocket ship in hindsight. It didn't feel like one to anyone living through it.