Forum: Concerned for an aging Bull Market? Vol. 2

("Matador and Dying Bull" Lithograph, by Salvador Dali)
Hi friends,
This is the second opinion piece on the subject of whether this historic bull market is about to roll over or not.
Feel free comment and resteem so we can start the conversation and see what Steemers believe to be the case. I also want to hear from people about what they think this moment in the bull market means for Steem, BTC, and cryptos generally.
Today's contribution is from Ben Morris.
Three Charts You Need to See Today
"The results have been extremely consistent. A year from now, stocks will likely be higher."
One year ago today, the benchmark S&P 500 Index traded at 2,110. The index was rising... But it hadn't hit a new all-time high in more than a year.
In DailyWealth Trader (DWT), that's when we looked at a stock market gauge that gave us a crystal-clear signal...
It said BUY!
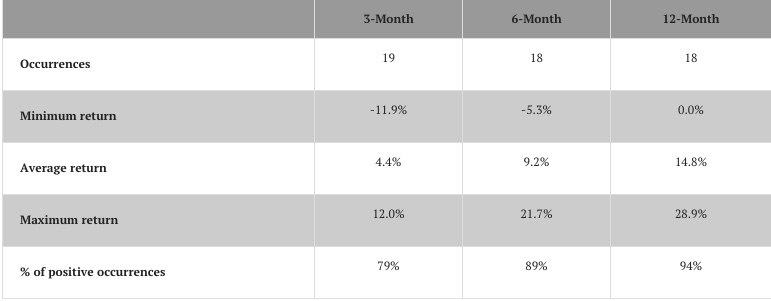
The signal had occurred 18 times over the prior 50 years. And one year following those signals, the S&P 500 was higher 94% of the time. The one time it wasn't higher, it was flat... a 0% return. The average one-year return was 14.8%.
As far as stock market signals go, that's about as good as it gets.
I hope you paid attention to that issue... and bought stocks. Yesterday, the S&P 500 closed at 2,429. That's 15.1% higher than it was one year ago... almost exactly what our signal suggested.
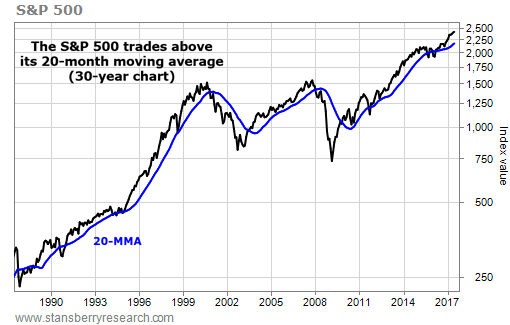
Today, we'll take a fresh look at that same stock market gauge – the 20-month moving average (MMA) – to see what it's telling us now. Be sure to read today's issue through to the end...
The 20-MMA works by collecting an asset's closing price on the last day of the month for the past 20 months, then takes the average of those prices.
This isn't a whole lot different than the 200-day moving average, which we talked about recently. But each point on the line spans 20 months... which is about twice as long as the 200-day average. And, because it uses only the closing prices for each month, it filters out a lot more stock market "noise."
This makes the 20-MMA a valuable gauge of the long-term trend. You can see what it looks like plotted on a chart – alongside the S&P 500 itself – below...
Last June 7, we noted that the S&P 500 crossed above its 20-MMA in March... and that it had held above that average for three straight months.
This confirmed (for us) that the uptrend was back. And we used that three-month confirmation as our signal. Here's the table we looked at last June, which shows what happened after prior signals...
Now, the S&P 500 has held above its 20-MMA for 15 consecutive months. So let's look at how stocks have behaved after similar periods in the past...
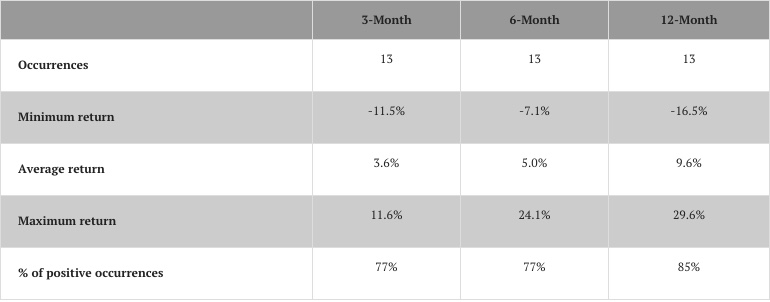
The results aren't nearly as good as the ones from last year's study. For the most part, they are better than the market's average returns without this signal. But it's not screaming "BUY" like it was last year.
Here are the three things I hope you take away from today's issue...
First, a year ago, lots of folks were worried about politics and world events. They were worried about another bear market like the last one. You may have been, too. But when an extremely consistent stock market indicator points to double-digit gains in the coming year, you should pay attention...
We've made a lot of great, profitable trades over the past year that bearish traders would have missed out on (not to mention the losses they likely took on their positions).
Second, for folks that are expecting a bear market soon, the signs don't point in that direction. They point to a better-than-average year. Protect your portfolio, of course... But don't get too bearish yet.
And finally, let's break the chart above down a little further. Specifically, let's look at how the action leading up to 1995 compares to the action leading up to 2016...
From 1988 through 1993, the S&P 500 ripped higher. A multiyear bull market was interrupted by a single drop below the 20-MMA (in 1990). In 1994, it dipped below the 20-MMA three times in the space of a year... Then it rocketed into the legendary dot-com bubble.
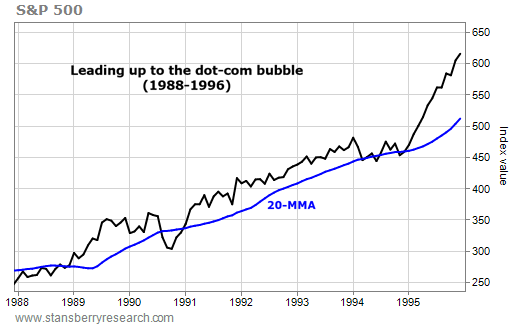
From 2009 through 2014, the S&P 500 ripped higher. A multiyear bull market was interrupted by a single drop below the 20-MMA (in 2011). In 2015 and 2016, it dipped below the 20-MMA two more times within the space of a year. Then it started higher again...

Now, I'm not saying the stock market will rise more than 200% from here, as it did in the late 1990s. But the charts look similar enough to take note.
I suggest you treat a "mania" phase in stocks as a possibility... not a probability. What does that mean in practice?
It means you should have money in stocks. And that you MUST follow the golden rule of trading (especially the second part): Cut your losers. And let your winners ride.
Life-changing gains are possible.
WHAT DO YOU THINK? DO YOU BUY IT? ARE YOU INVESTED?