Forex Pattern Cheat sheet -part 1 Single reversal patterns
This was my little project since starting with Forex trading and I came across an idea I could share with you my cheat sheets for Forex trading based on technical analysis
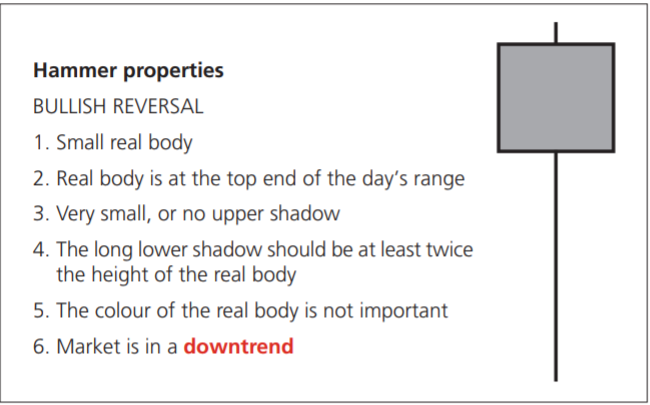
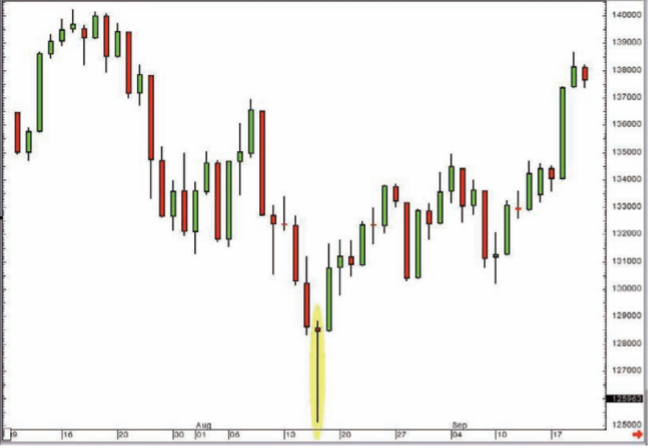
HAMMER
EXAMPLES
Color of the real body on a Hammer doesn't matter.
Summary:
A Hammer is a single candle reversal pattern that’s found in a market that has been
falling, with a small real body at the top end of the candle’s range, which leaves a
long lower shadow.
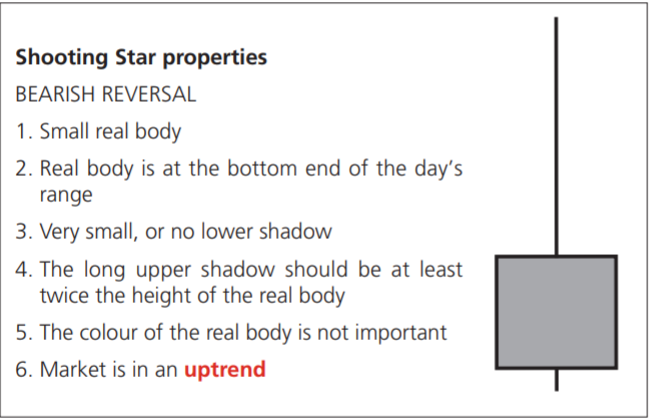
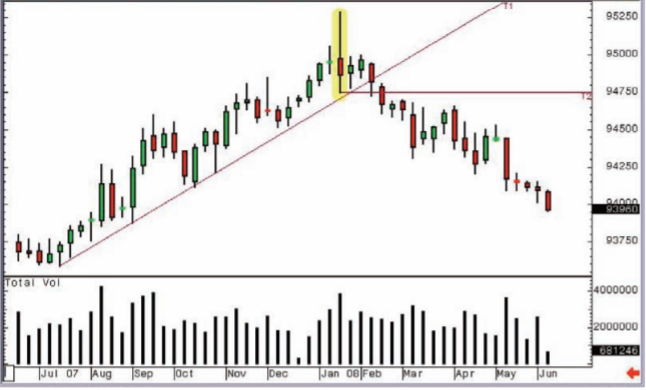
SHOOTING STAR
EXAMPLES

Color:
As with the Hammer we are relatively unconcerned by the colour of the real body
for a Shooting Star, although a red real body does show that the market sold off
through the opening price towards the end of the candle’s life, and therefore it may
carry slightly more significance. It’s not essential for the pattern though, and
Shooting Stars are generally credited with being a powerful reversal pattern,
whatever the color of the real body.
SUMMARY:
You can see that the Shooting Star is the exact opposite to the Hammer. The
construction and psychology are exactly the same but in reverse.
It is a single candlestick in a rising market with a long upper shadow and a small
real body at the bottom end of the candle’s range.
In summing up the Hammer I said that it was one of my favourites, so it follows
that its bearish opposite number will also be high on my list. It is indeed. These
patterns are so simple yet so effective. Just the sort of technical analysis I like!
As with the Hammer it’s also worth highlighting that these are generally great
patterns to look out for on short-term charts (10 to 30-minute) for futures contracts
or equities that trade with a combination of good volume and volatility.
INVERTED HAMMER
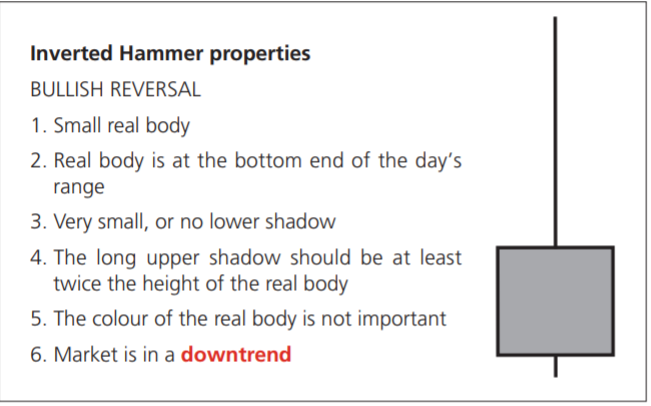
If you see a candlestick shaped like a Shooting Star during a downtrending market,
you’re looking at an Inverted Hammer, which is a bullish reversal pattern.
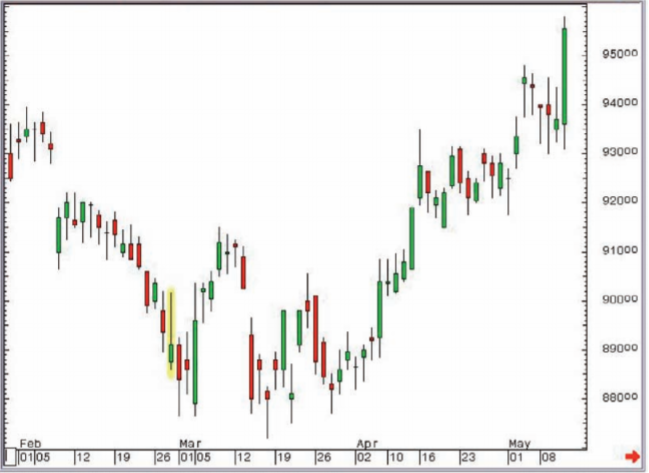
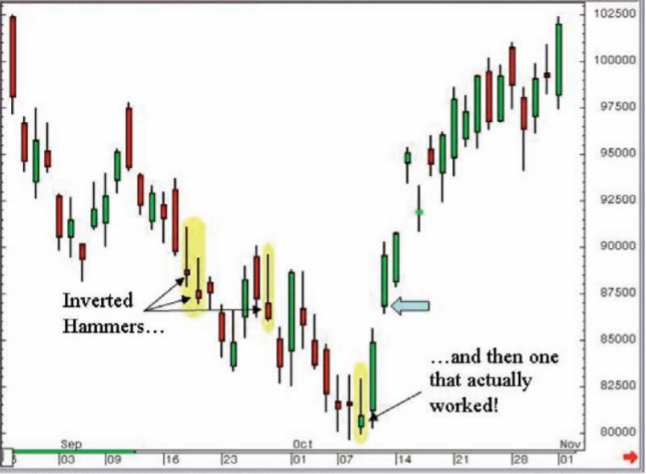
EXAMPLES:
SUMMARY:
The Inverted Hammer isn’t generally the strongest of reversal patterns. However,
it can be a good warning of an impending reversal because it’s a candle that
illustrates that the bulls aren’t completely dead and buried; they’re starting to make
noises, even if on this occasion it came to nothing because the bears stepped back
in to sell into the gains towards the end of the formation of the candle.
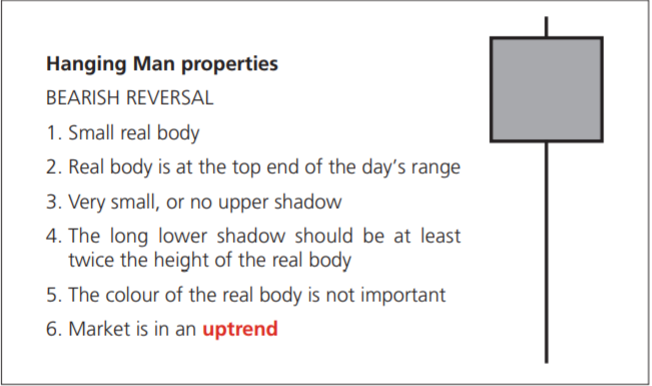
HANGING MAN
EXAMPLES
SUMMARY:
A Hanging Man candlestick is the same shape as a Hammer, but is seen during a
rising market.
I’m sure you’ll agree with me that after finding out all about this pattern it’s a bit
of an anticlimax. What a great name, summoning up the most bearish of bear
thoughts! In reality it can be a good warning signal that the sellers are stirring after
a period of domination by the bulls, but it’s not often the horrid disaster that its
name might suggest!
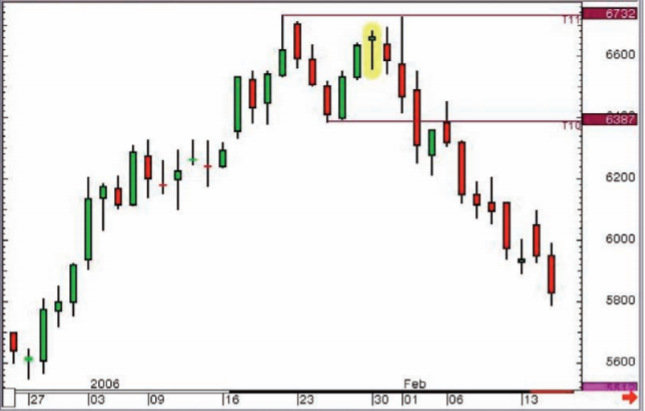
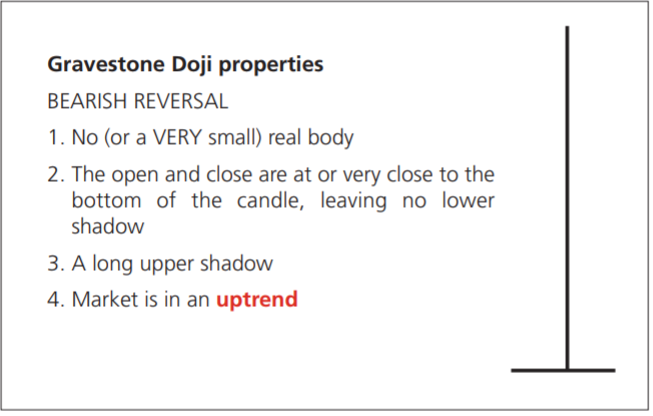
GRAVESTONE DOJI
EXAMPLES

SUMMARY:
A Gravestone Doji is the ultimate Shooting Star; a Doji candlestick, with an open
and close at very similar levels, in this instance right on or very near the candle’s
low.
This pattern is indeed something to feel rather morbid about, especially if you’ve
been riding a strong uptrend. Your time might be up...
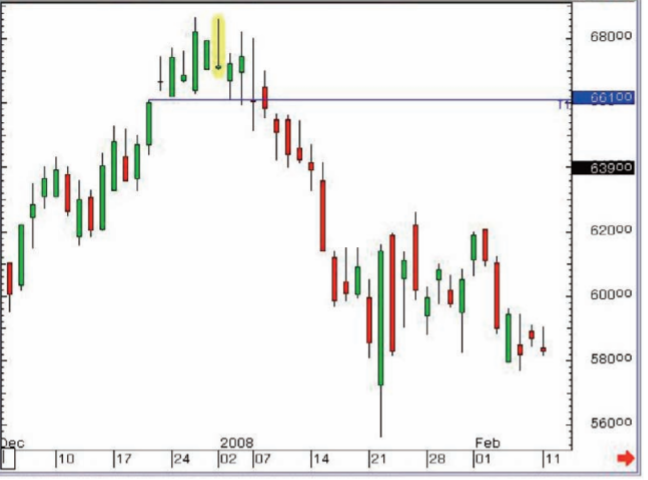
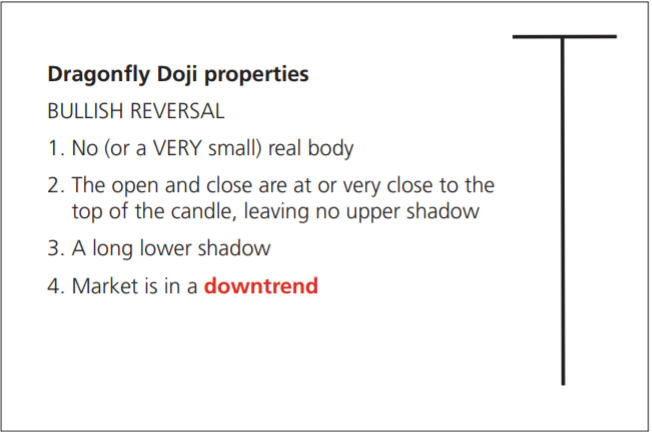
DRAGONFLY DOJI
EXAMPLES
SUMMARY
A Dragonfly Doji or Umbrella Doji is generally a strong reversal pattern in a
downtrending market. It is a Doji with an open and close at the top of the
candlestick, leaving the real body looking like a line across the top of a vertical
line, hence the rather descriptive names. These Doji look like an Umbrella or a
Dragonfly. Not a pattern to be ignored.
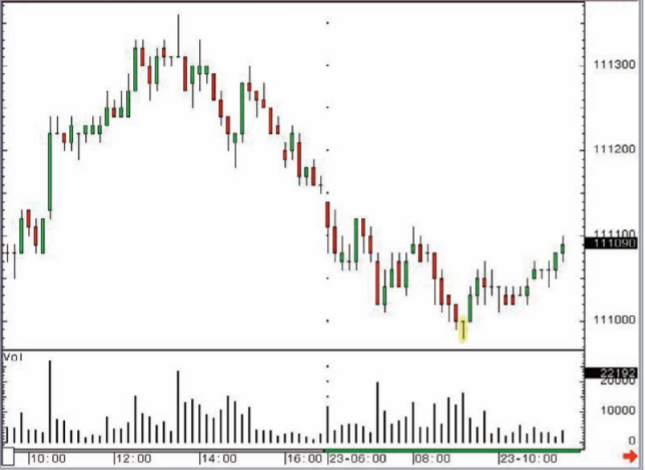
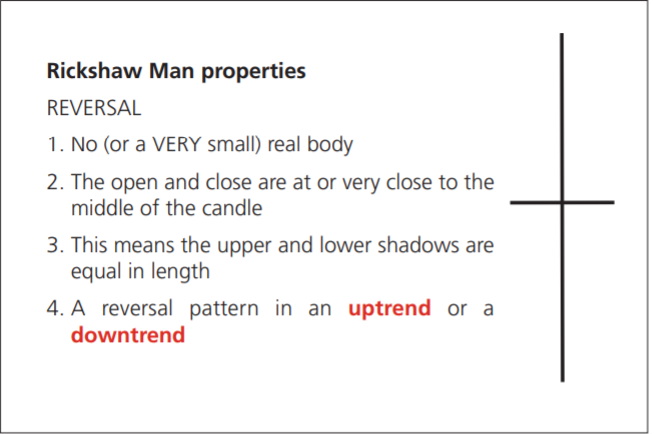
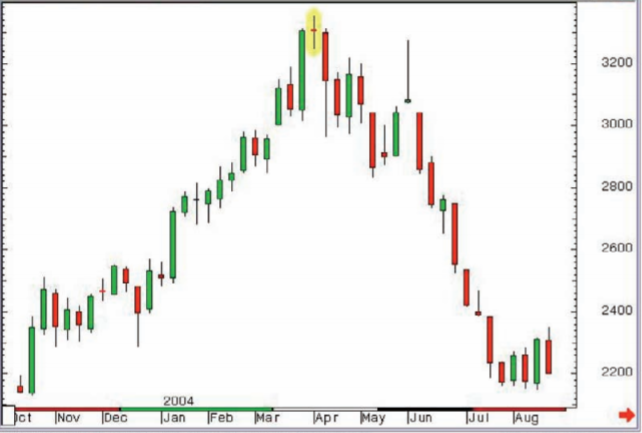
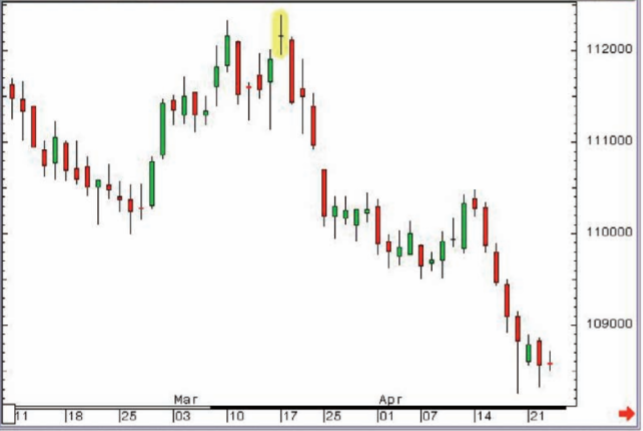
RICKSHAW MAN
EXAMPLES
SUMMARY
A Rickshaw Man is a Doji with an open and close near the middle of the candle’s
range. I have to admit it took a while to find really good examples of this pattern,
which proves that maybe it is only in here because its name has mildly amusing
connotations of confused men carting Rickshaws around, unable to work out which
direction to take next! I wouldn’t devote too much time in the pursuit of the perfect
Rickshaw Man; there are better ways to spend your time!
That would be all from me for today. I will keep posting for all possible patterns I have. Don't use this as a material for learning because you will not understand it at all. Use it only as a little cheat sheet when you are trading to help you :)
This is a great cheat sheet, it helps me punch out of my weight class when talking about the market. Also the post has some interesting points on market trends.
Thank you :) I hope it will help you out on the market
Congratulations @crobben! You have received a personal award!
Click on the badge to view your Board of Honor.
Do not miss the last post from @steemitboard!
Participate in the SteemitBoard World Cup Contest!
Collect World Cup badges and win free SBD
Support the Gold Sponsors of the contest: @good-karma and @lukestokes