www.putcapital.com Morning Signals analysis for Monday 21st August 2017
21st August 2017
21 August 2017
00:37

Not much happening on the Economic calendar today, however The world’s top central bankers head to Jackson Hole amid growing unease about low inflation
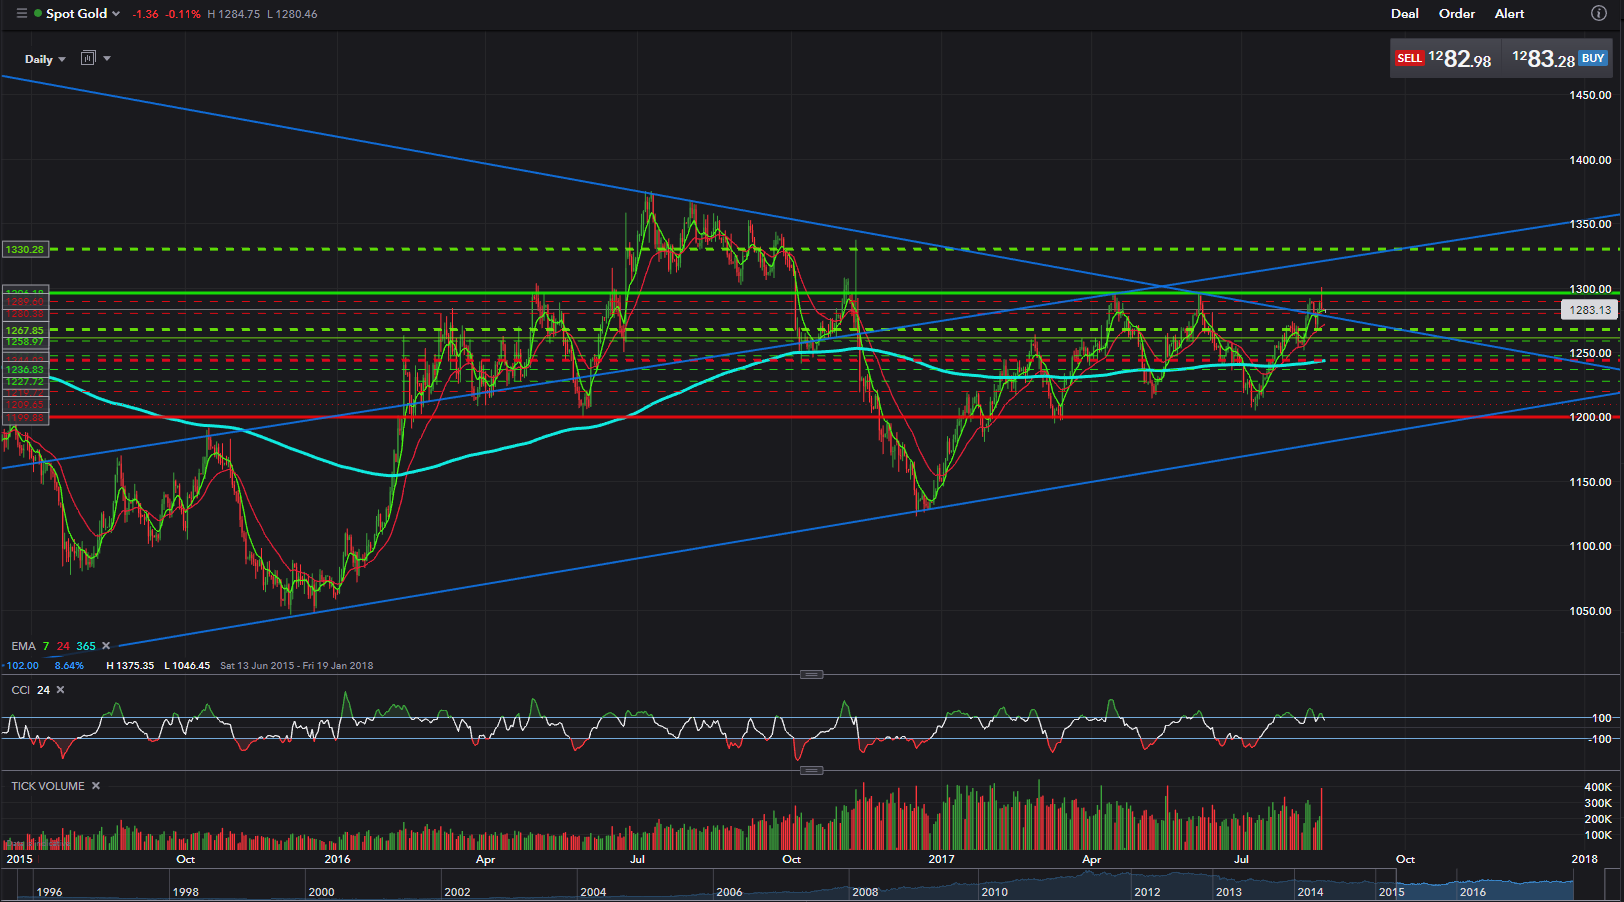
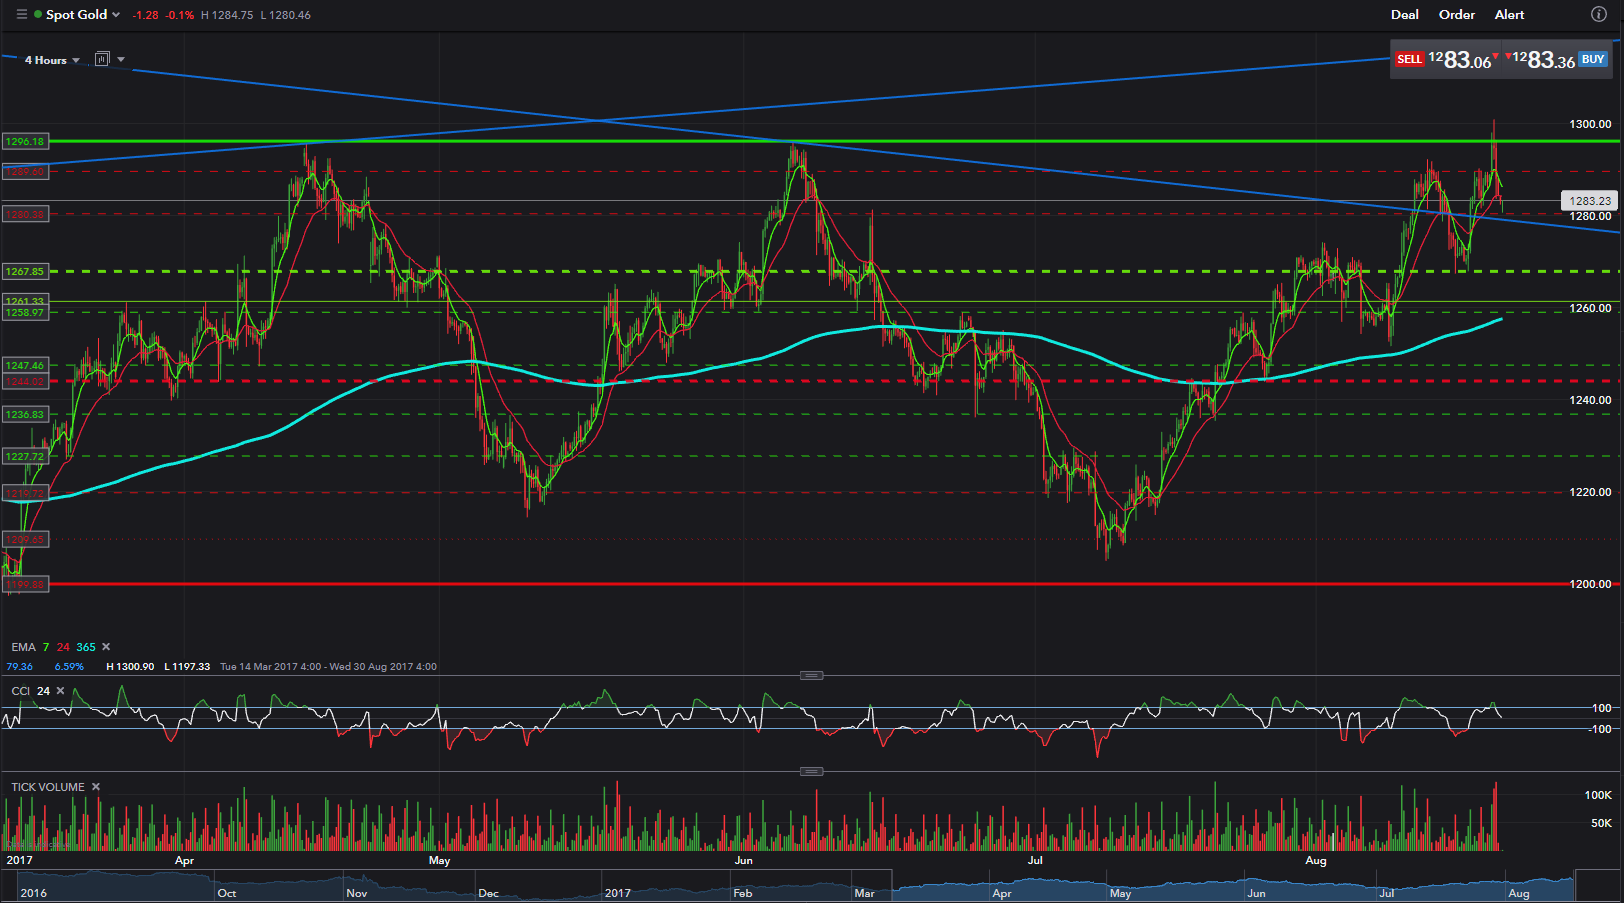
GOLD - BUY - 1286.40
Since the start of 2017, Gold has not broken above 1290 ish, bouncing 3 times off the resistance. Over the weekend we have seen Gold Test and break through this resistance and peak at 1300 before falling back down. This and the fact that we broke above the Symmetrical Triangle in the middle of last week, is a strong indication that we are going to see a rally. Looking at past charts, the next obstacle is around 1330. We have just bounced off the 61.8 Fibonacci and start to head back up. I expect Gold to Rally today, and smash through the 1300 Level. The 24 hour CCI is just about to break out from the OS position and the MA is indicating an uptrend.

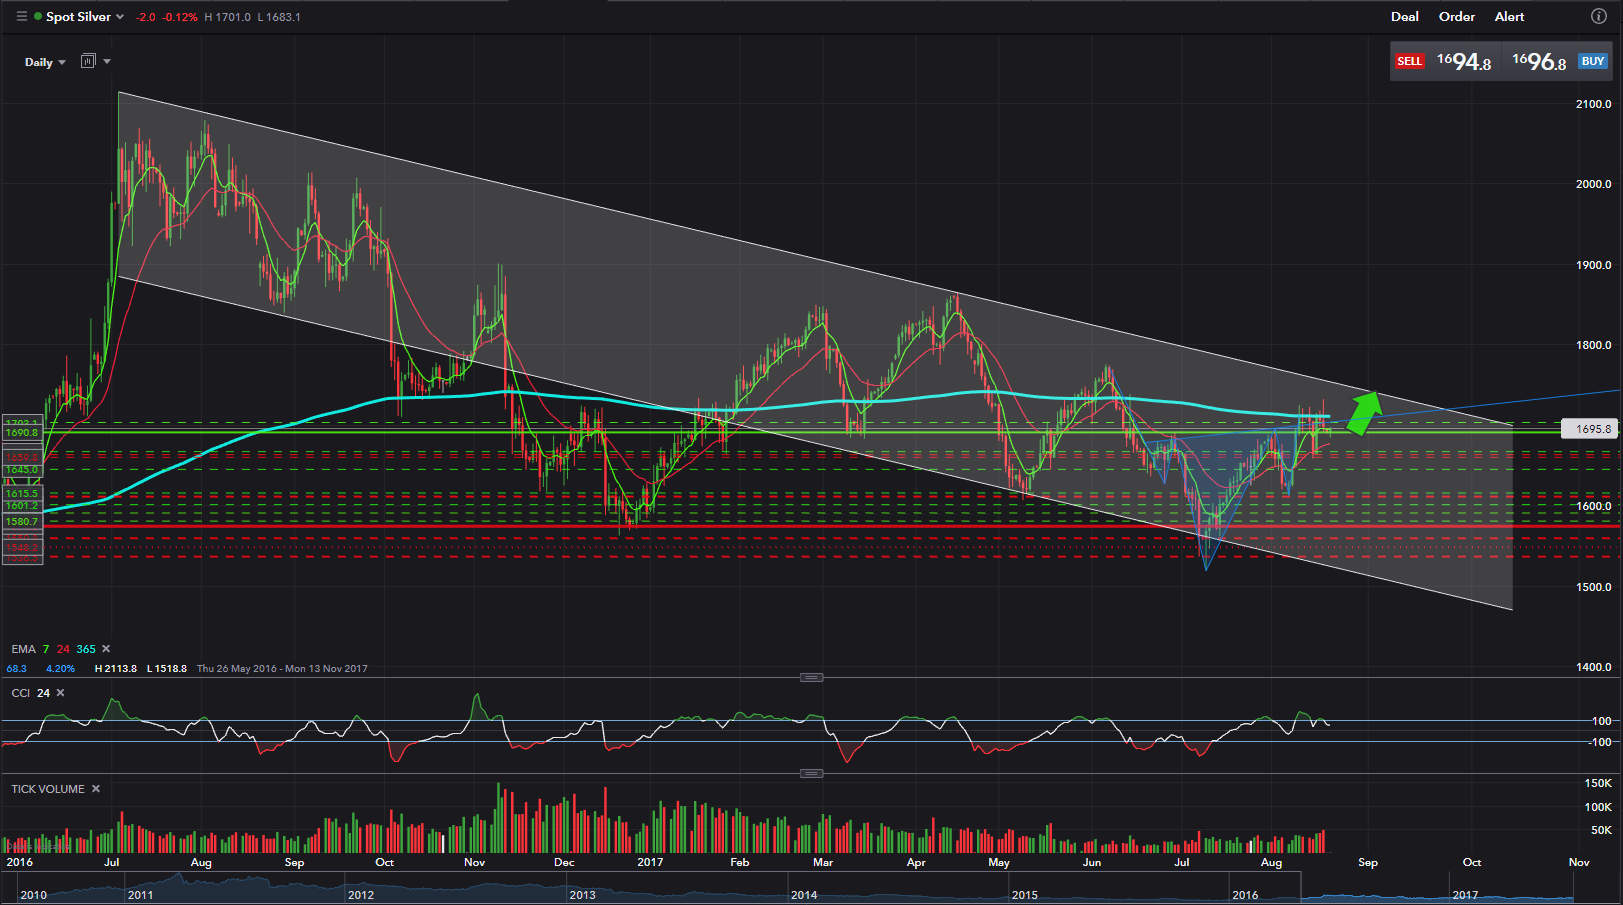
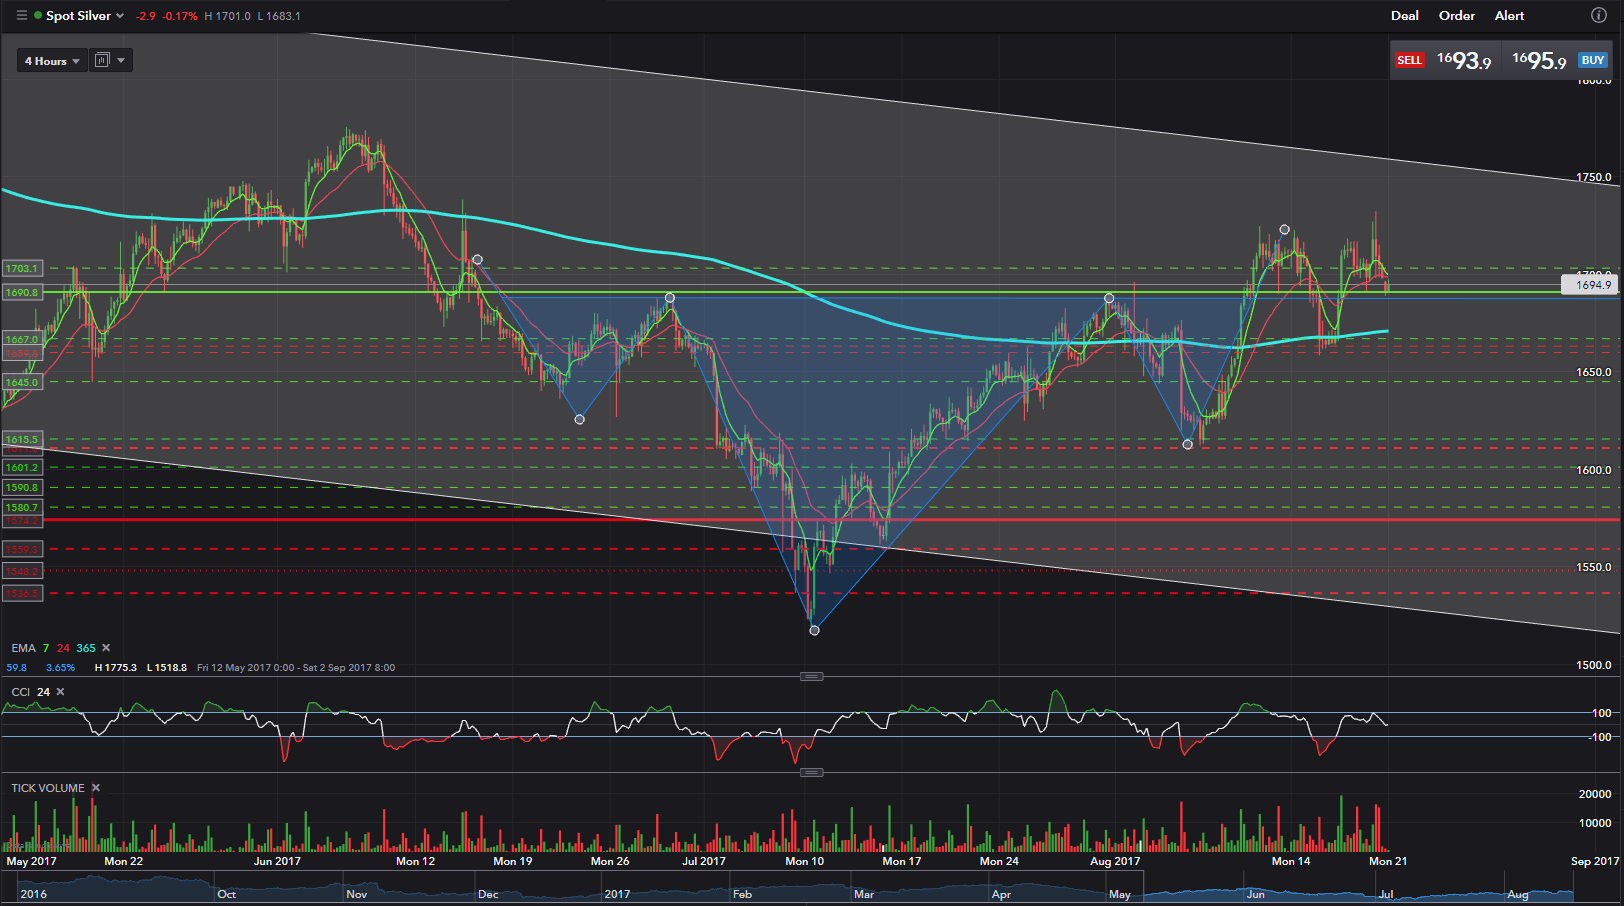
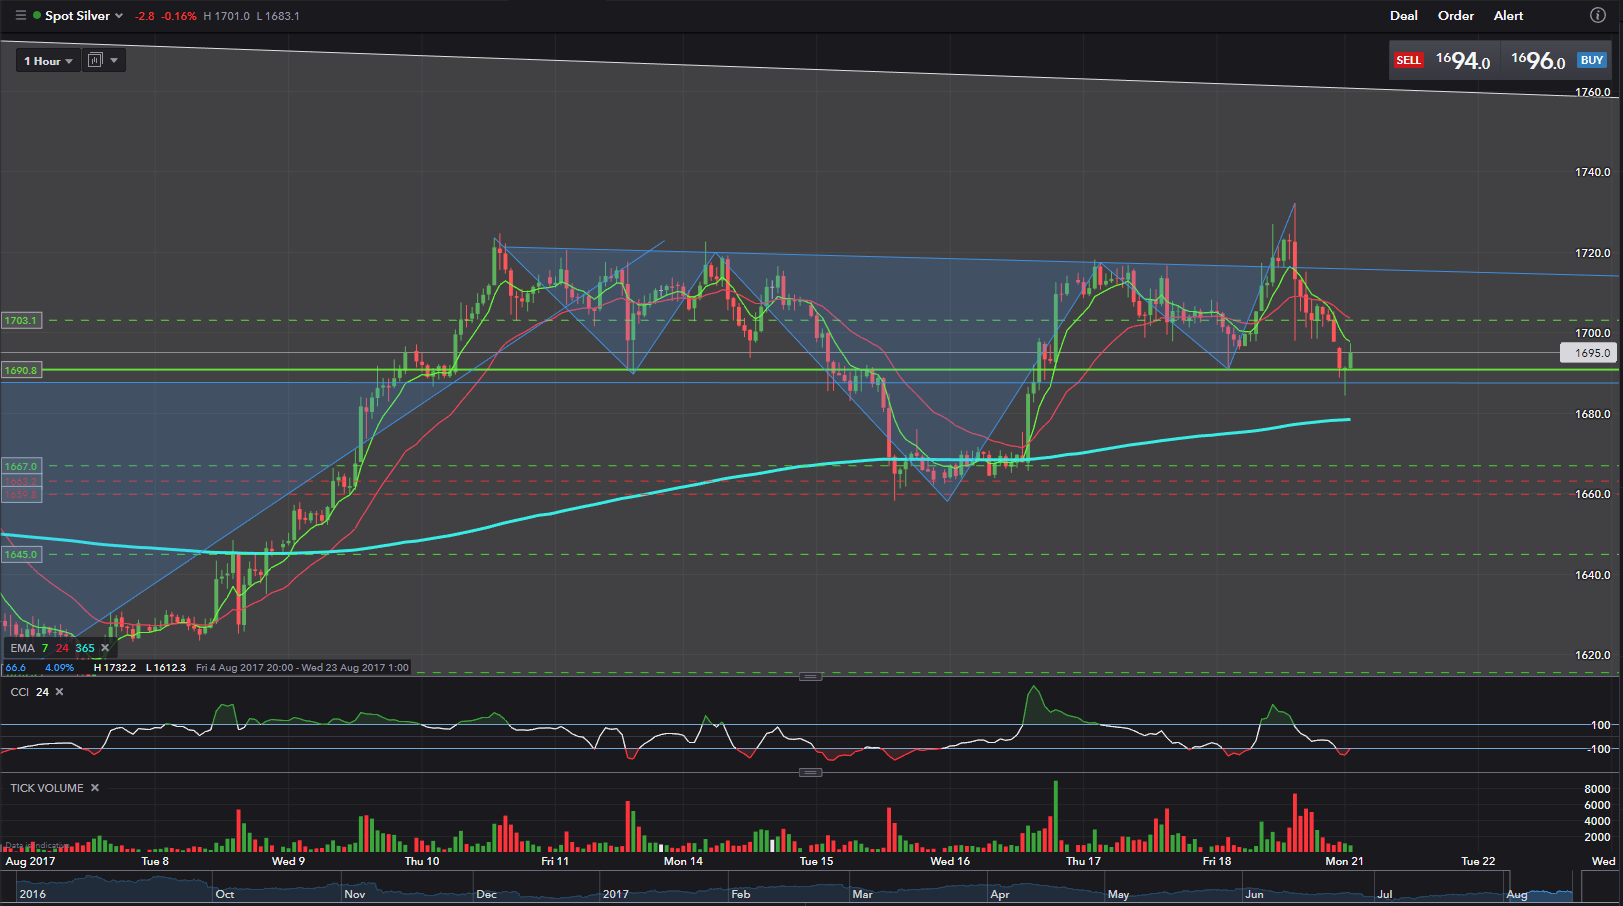
SILVER - BUY - 1703.10
Silver has just bounced off the 1690 Support line and is OS on the 24 Hr CCI. The daily chart shows Silver in a downward channel since July of 2016, however reading through the news, 86% of traders are net long, and looking at the daily chart, we have just had a reverse Head and Shoulders pattern, or as I like to call them "Grandads Dangly Bits Pattern" …… The Hourly chart reveals another Reverse Head and Shoulders pattern which is why I feel Silver is going to break out to the upside any day and with the Negative media on Trump accumulating, Gold and Silver are usually the safe havens and will see more traders jump on board.
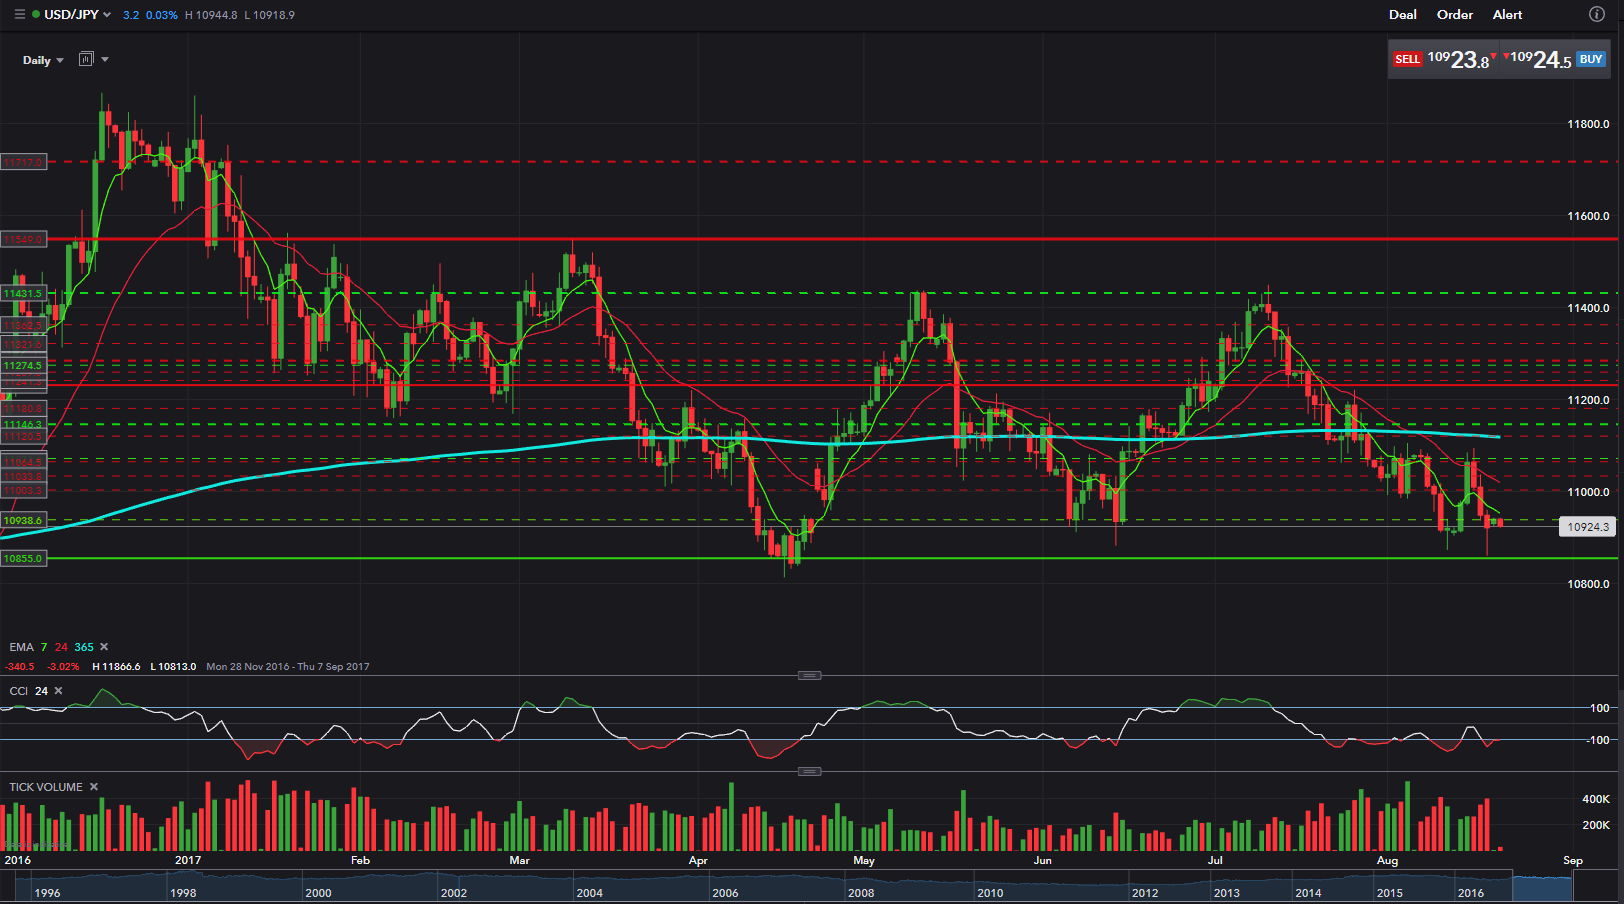
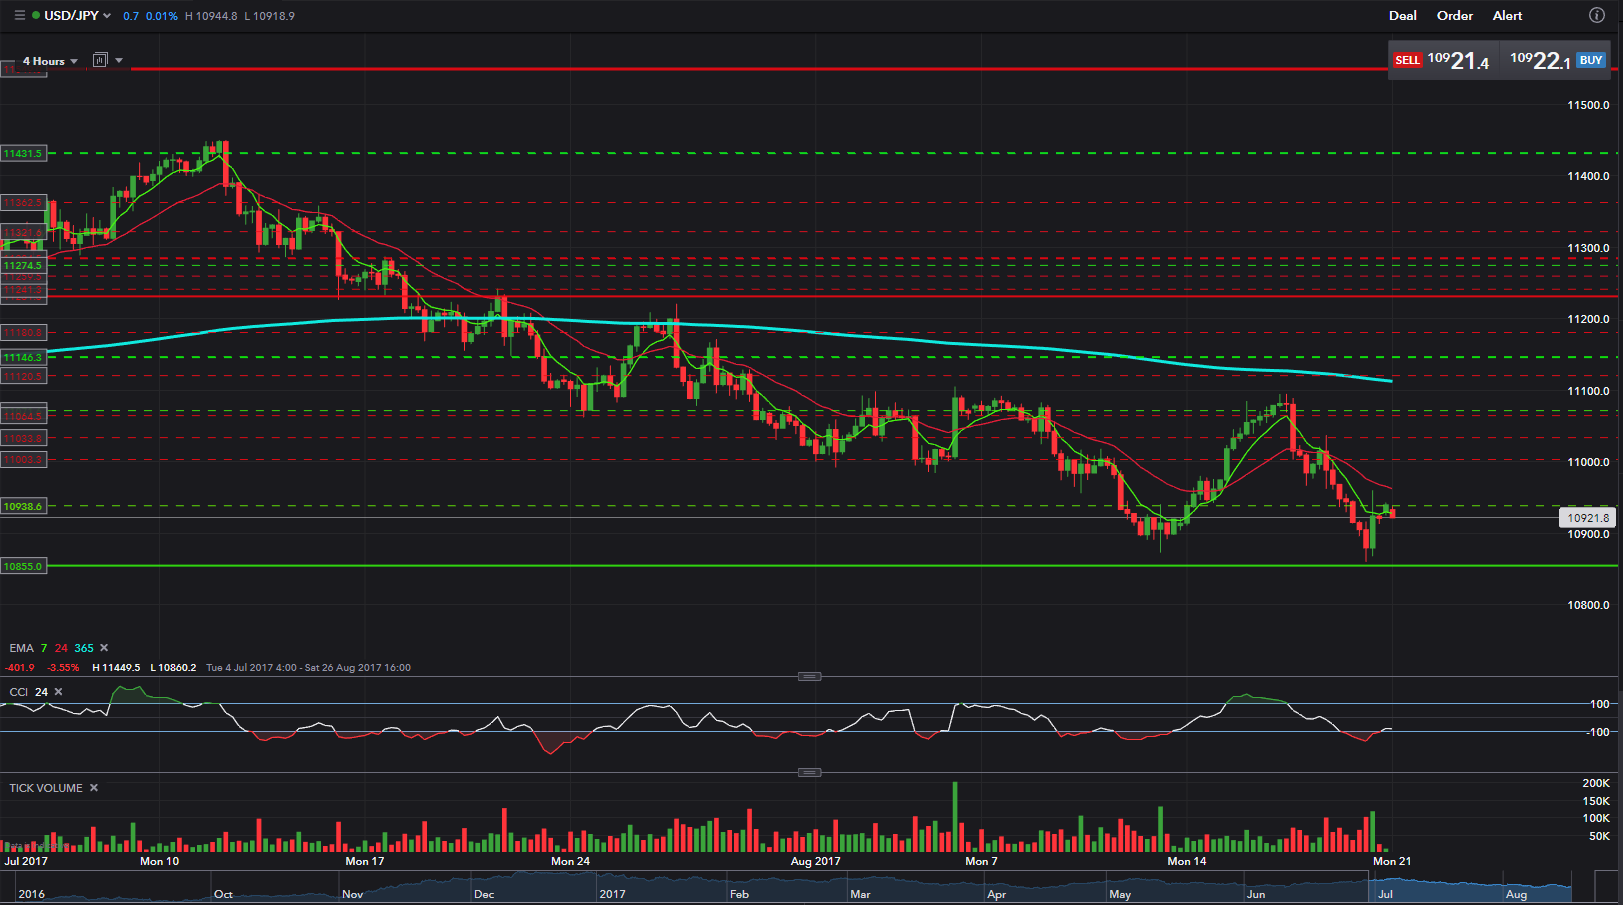
USD/JPY - SELL - 109.160
Friday has seen this currency pair bounce off the long standing support line which has not been breached in a downward movement since June 2016. On the daily chart we are OS on the 24hr CCI. The Hourly Chart has seen the formation of a BAT pattern. This being the case, we should see this pair climb towards the 110.050 Level, however with the N.Korea risks rearing its ugly head again this week, increasing political turmoil in the whitehouse and at the start of the FX week in Asia, USD/JPY is relatively stable in the open of Tokyo and supported at 109.19/20. Expects yen strength to prevail this week, and on a technical basis - in the shorter term and according to the 4 hours chart, the pair is well below the bearish MA. The Technical indicators barely corrected oversold conditions before losing their upward strength, also supporting additional declines ahead.

great analysis of trading.
wow this is intresting. i will follow you and upvote you
https://steemit.com/@sahajan