Insatiable Global Appetite For U.S. Dollars
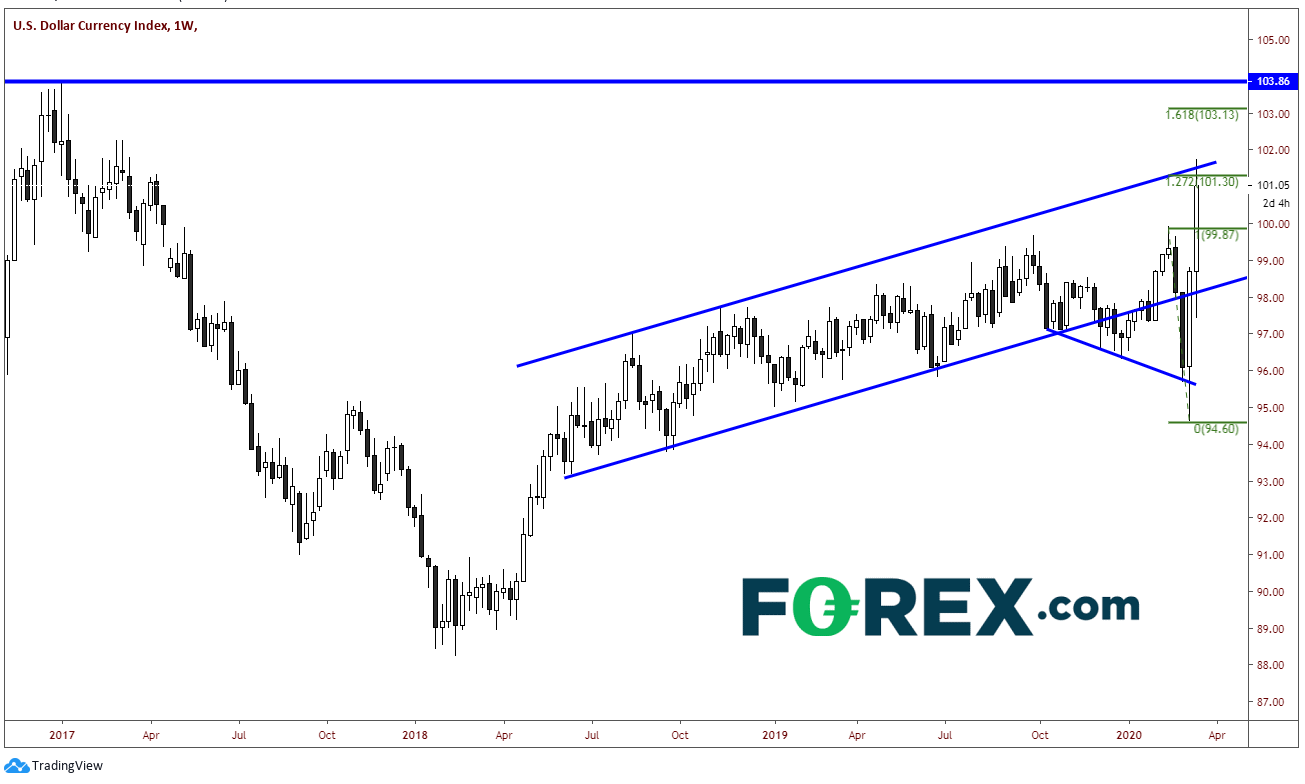
The U.S. dollar is in high demand as markets around the world are sold and investors search for a place to park their money. This pushed the DXY 2.5% higher yesterday, to 101.74.
Tuesday's close was 99.50! DXY is up 3% this month so far, while the range for the month is 6%.
Why is the U.S. dollar so bid? In addition to demand from the flight to safety trade, banks are reluctant to lend cash to low creditworthy firms and foreign banks. They are also concerned that small businesses may not be able to may back loans. In addition, the companies that do have strong ratings are drawing on their lines of credit to raise cash. These are all contributing to the demand for U.S dollars. Due to this strong demand, the Federal Reserve is taking unprecedented actions to make sure the supply is there when it’s needed. Some of these actions include slashing interest rates to 0% (from 1.75% in January) and increasing participation in the overnight commercial paper market, which firms use to fund day to day operations.
In order to find resistance for the DXY, we must look at a weekly chart. The U.S. dollar is currently trading at the 127.2% Fibonacci extension from the mid-February highs to last week’s lows near 101.30. There is also channel resistance dating back to May 2018 near 101.50. Price has spiked through both those levels today, therefore, yesterday’s highs of 101.74 now become resistance. Above that is 103.86, which is the high in early 2017. Support is 99.90!
Take note of the average true range (ATR) on a daily timeframe. The true range is the greatest of the current high less the current low, the absolute value of the current high less the previous close, and the absolute value of the current low less the previous close. Therefore, the ATR is a moving average, usually using 14 days, of true ranges. (Investopedia). From the beginning of 2019 until February 20th, 2020, the ATR has been roughly between 30 and 50 pips for the DXY.
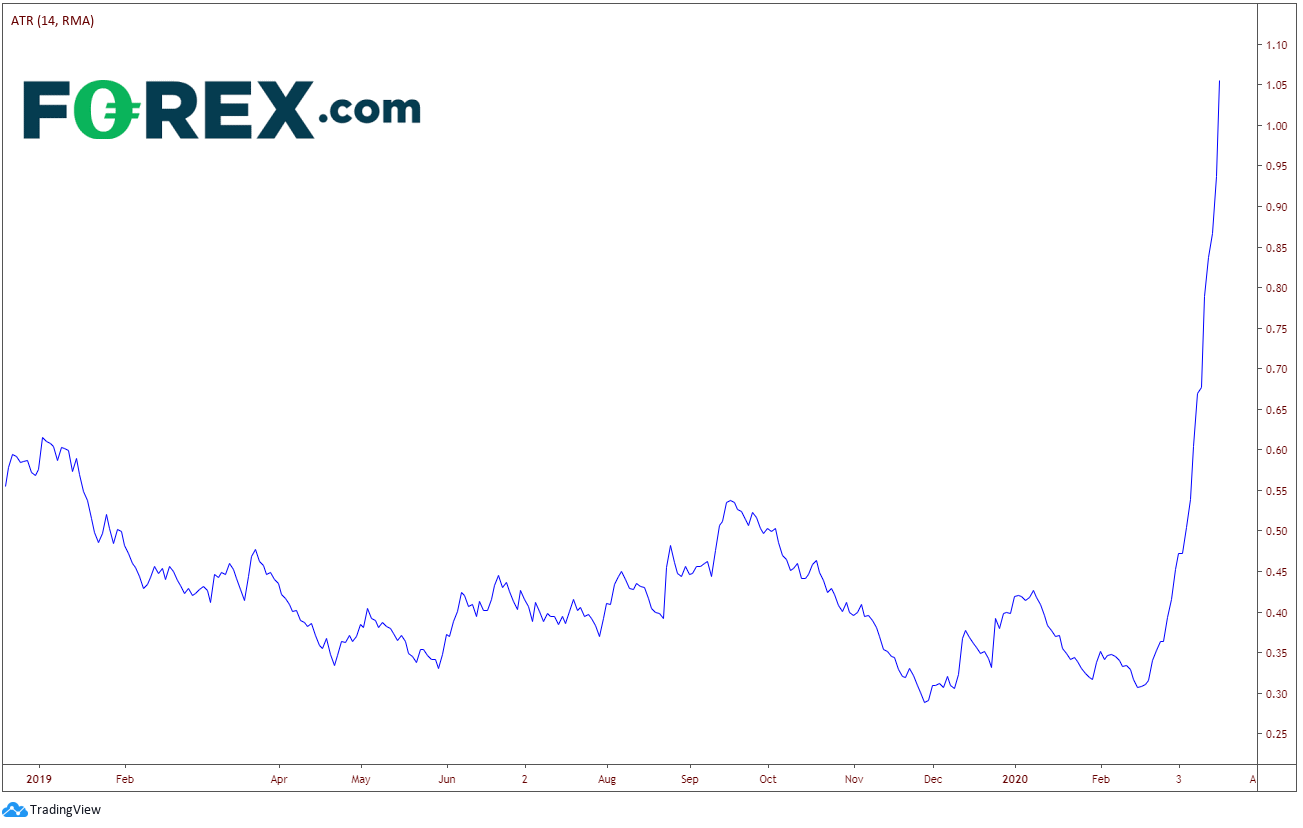
This is important because traders need to compensate for the volatility in their trading. One way to do this is for traders to decrease the “size” of their trades to 1/3 of their normal trading size. This will give traders the same risk/reward as if volatility was between the 30 and 50 pips before February 20th.
You will see this type of action in the ATR of other instruments as well. Trade safe. Account preservation is paramount.
Join the community in our migration to Hive, a community built blockchain for the community. All Steem account holders will receive equivalent stake on the new Hive blockchain.
Please see this post on SteemPeak for more information.