You are viewing a single comment's thread from:
RE: Daily Technical Analysis: 16/2/18
Thanks for your question! My trading signals are based on several factors, support & resistance level is one of them. Finding them out is quite simple.
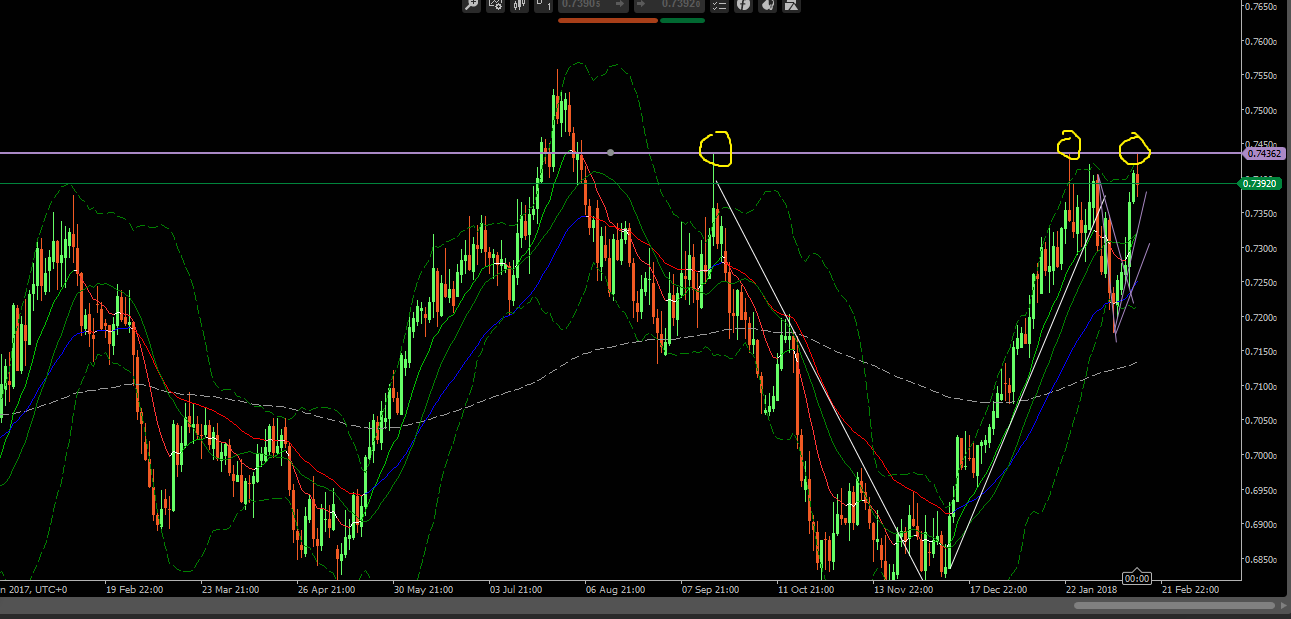
For example: NZDUSD (NU)
Look at the D1 chart: I draw a horizontal line to determine the resistance. Pay attention to where I mark the yellow.
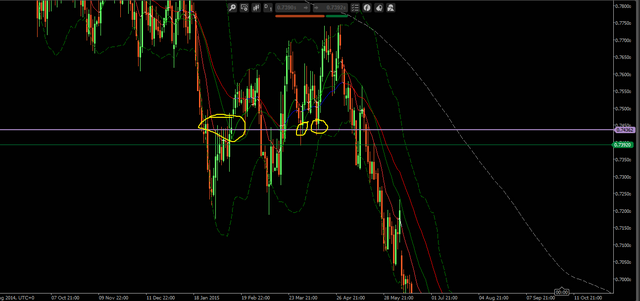
Because of I am a Day trader so I look at the H4 chart:
H4 chart:
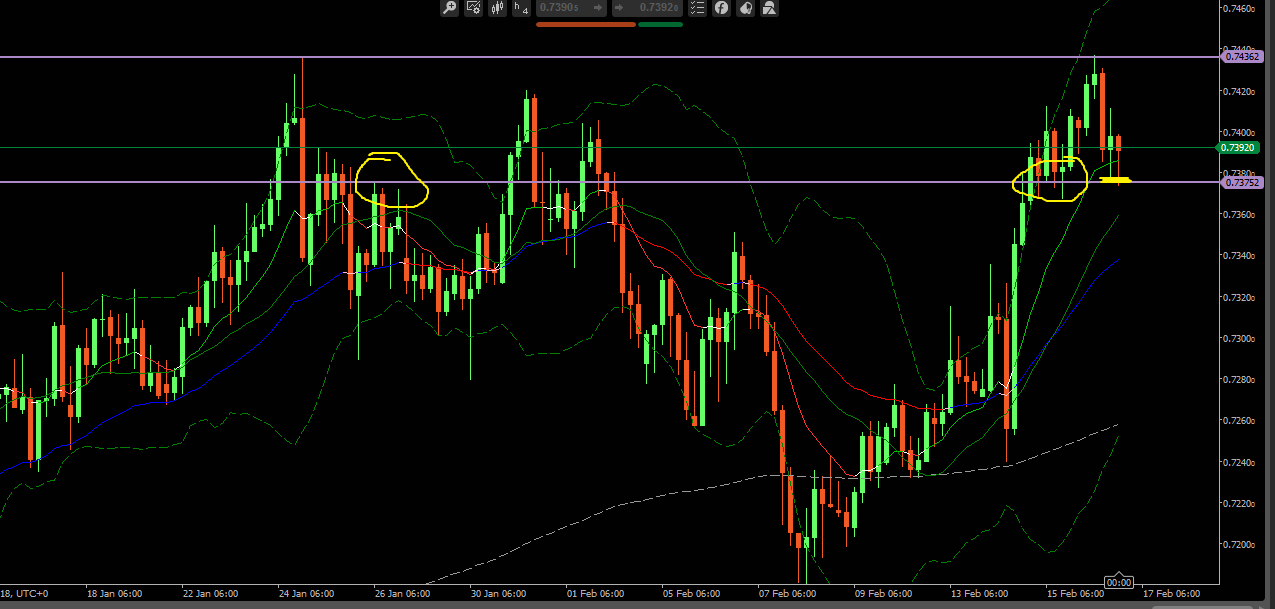
Look at these chart, you can see how I get the resistance and the support level!
However, if there are some other references, the resistance and the support level will be more reliable.