Gold (XAUUSD) Daily Chart Analysis: Recent Price Action Overview
🪙 Market Overview
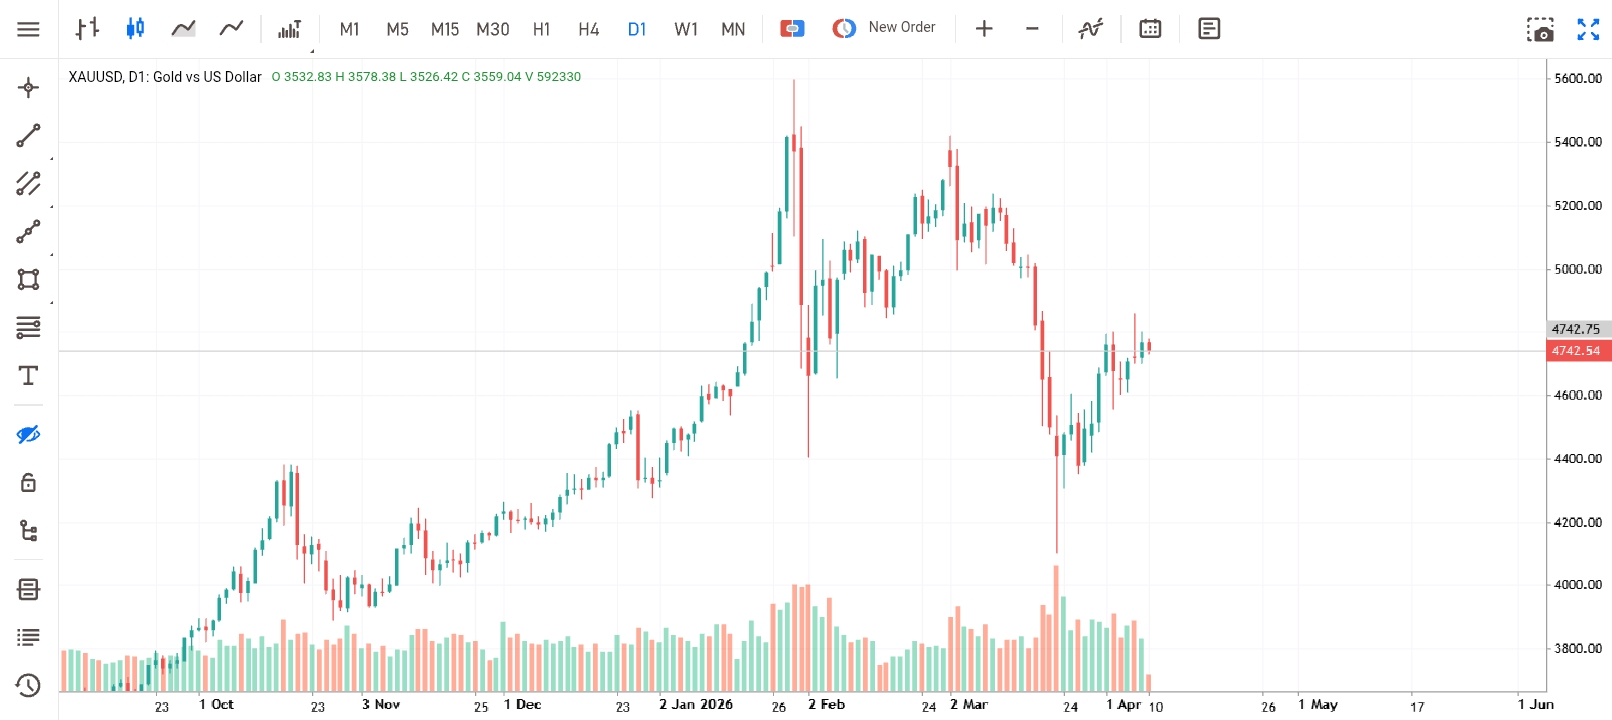
As of April 10, 2026, gold (XAUUSD) has experienced significant volatility over the past several months. The chart shows a strong bullish trend starting from late 2025, peaking around late January 2026, followed by a sharp correction in February and March. Recently, gold has been recovering, showing signs of consolidation around the $4700-$4750 level.
Volume bars indicate fluctuating trading activity, with spikes during major price moves, reflecting strong market participation during both rallies and corrections.
📉 Price Action Insight
Key observations:
🟢 Uptrend: From October 2025 through January 2026, gold steadily climbed with higher highs and higher lows.
🔴 Sharp Correction: Late January to March 2026 saw a steep decline, with large bearish candles and increased volume, signaling strong selling pressure.
⚖️ Consolidation and Recovery: Since late March, price has been recovering and consolidating near the $4700 level, suggesting a potential base for the next move.
Volume analysis:
High volume during the correction phase indicates strong participation in the sell-off.
Recent volume is moderate, consistent with consolidation and cautious buying.
🔍 What This Means for Traders
The market is currently in a recovery phase after a significant correction.
Traders should watch for:
🔄 Confirmation of support around current levels for potential long entries.
⚠️ Signs of resistance or failure to break above recent highs for caution on bullish bias.
Risk management is crucial given the recent volatility and potential for further swings.