Crypto Trading Strategy with Triple Exponential Moving Average (TEMA) indicator - Crypto Academy / S6W2 - Homework Post for @fredquantum. by @abdu.navi03
Hello everyone. How are you all? I hope fine. So first of all, I warmly welcome you all to the week 2 of season 6 of the crypto academy. This is my first dynamic course of this season.
In this lecture by Professor @fredquantum , we learned the basics of Crypto Trading Strategy with Triple Exponential Moving Average (TEMA) Indicator


Crypto trading is a very popular model of trading compared to stocks or forex. Its volatility is one of the major reasons but the real reason is a person who wants to trade in it can be a part of it without doing the learning of years. Why is that because this market is prawn to two things, news, and technical analysis? Although a little bit of news or just a tweet can destroy all the technical analysis. In technical analysis, the first thing a new trader learns and can easily trade with it in this market is moving average. Which is just an average of certain periods back. That means it acts like a historical ghost to the price and where it could be.
Moving average also evolves with time, as some like it fast, to make better entries, and some like it slow and lagging to make their entries safest. In fast-moving averages, the exponential moving average is really good. But for Patrick Malloy, it wasn’t still enough. Because there’s a quote in stock trading that if you are doing what everyone is doing, you are not doing enough. Therefore, keeping in mind the importance of EMA, Patrick Malloy has developed an indicator that is like EMA but still different from EMA. He named it Triple EMA. The major reason to develop it is the fault in EMA. EMA is faster than MA but still somewhat a lagging indicator when switches to higher lengths. A trader must shift to higher lengths to dodge the noises and false signals by the indicator. TEMA be fast and accurate, without any lagging in higher lengths, and do not produce noises in the indication either.
CALCULATIONS OF TEMA
Triple EMA, as its name elaborates, contains three EMA. But in which sequence and calculations, we’ll dissect below.
TEMA= (3EMA1)-(3EMA2)+EMA3
Where,
EMA1=Exponential Moving average
EMA2=EMA of EMA1
EMA3=EMA of EMA2
It is must note that all the EMAs will work on one length. But they work in such a way that multiplying EMA1 and EMA2 by three will create a lag but then filter it their difference will play the role. To minimize the noise, after subtraction the value is too noisy, the EMA3 is added which is basically the EMA of EMA2, meanwhile, the EMA2 is the EMA of EMA1. These complex calculations the end produce the neutral effects and make the chart fast but without noises just like an Audi8.
Let me elaborate on TEMA pictorially.
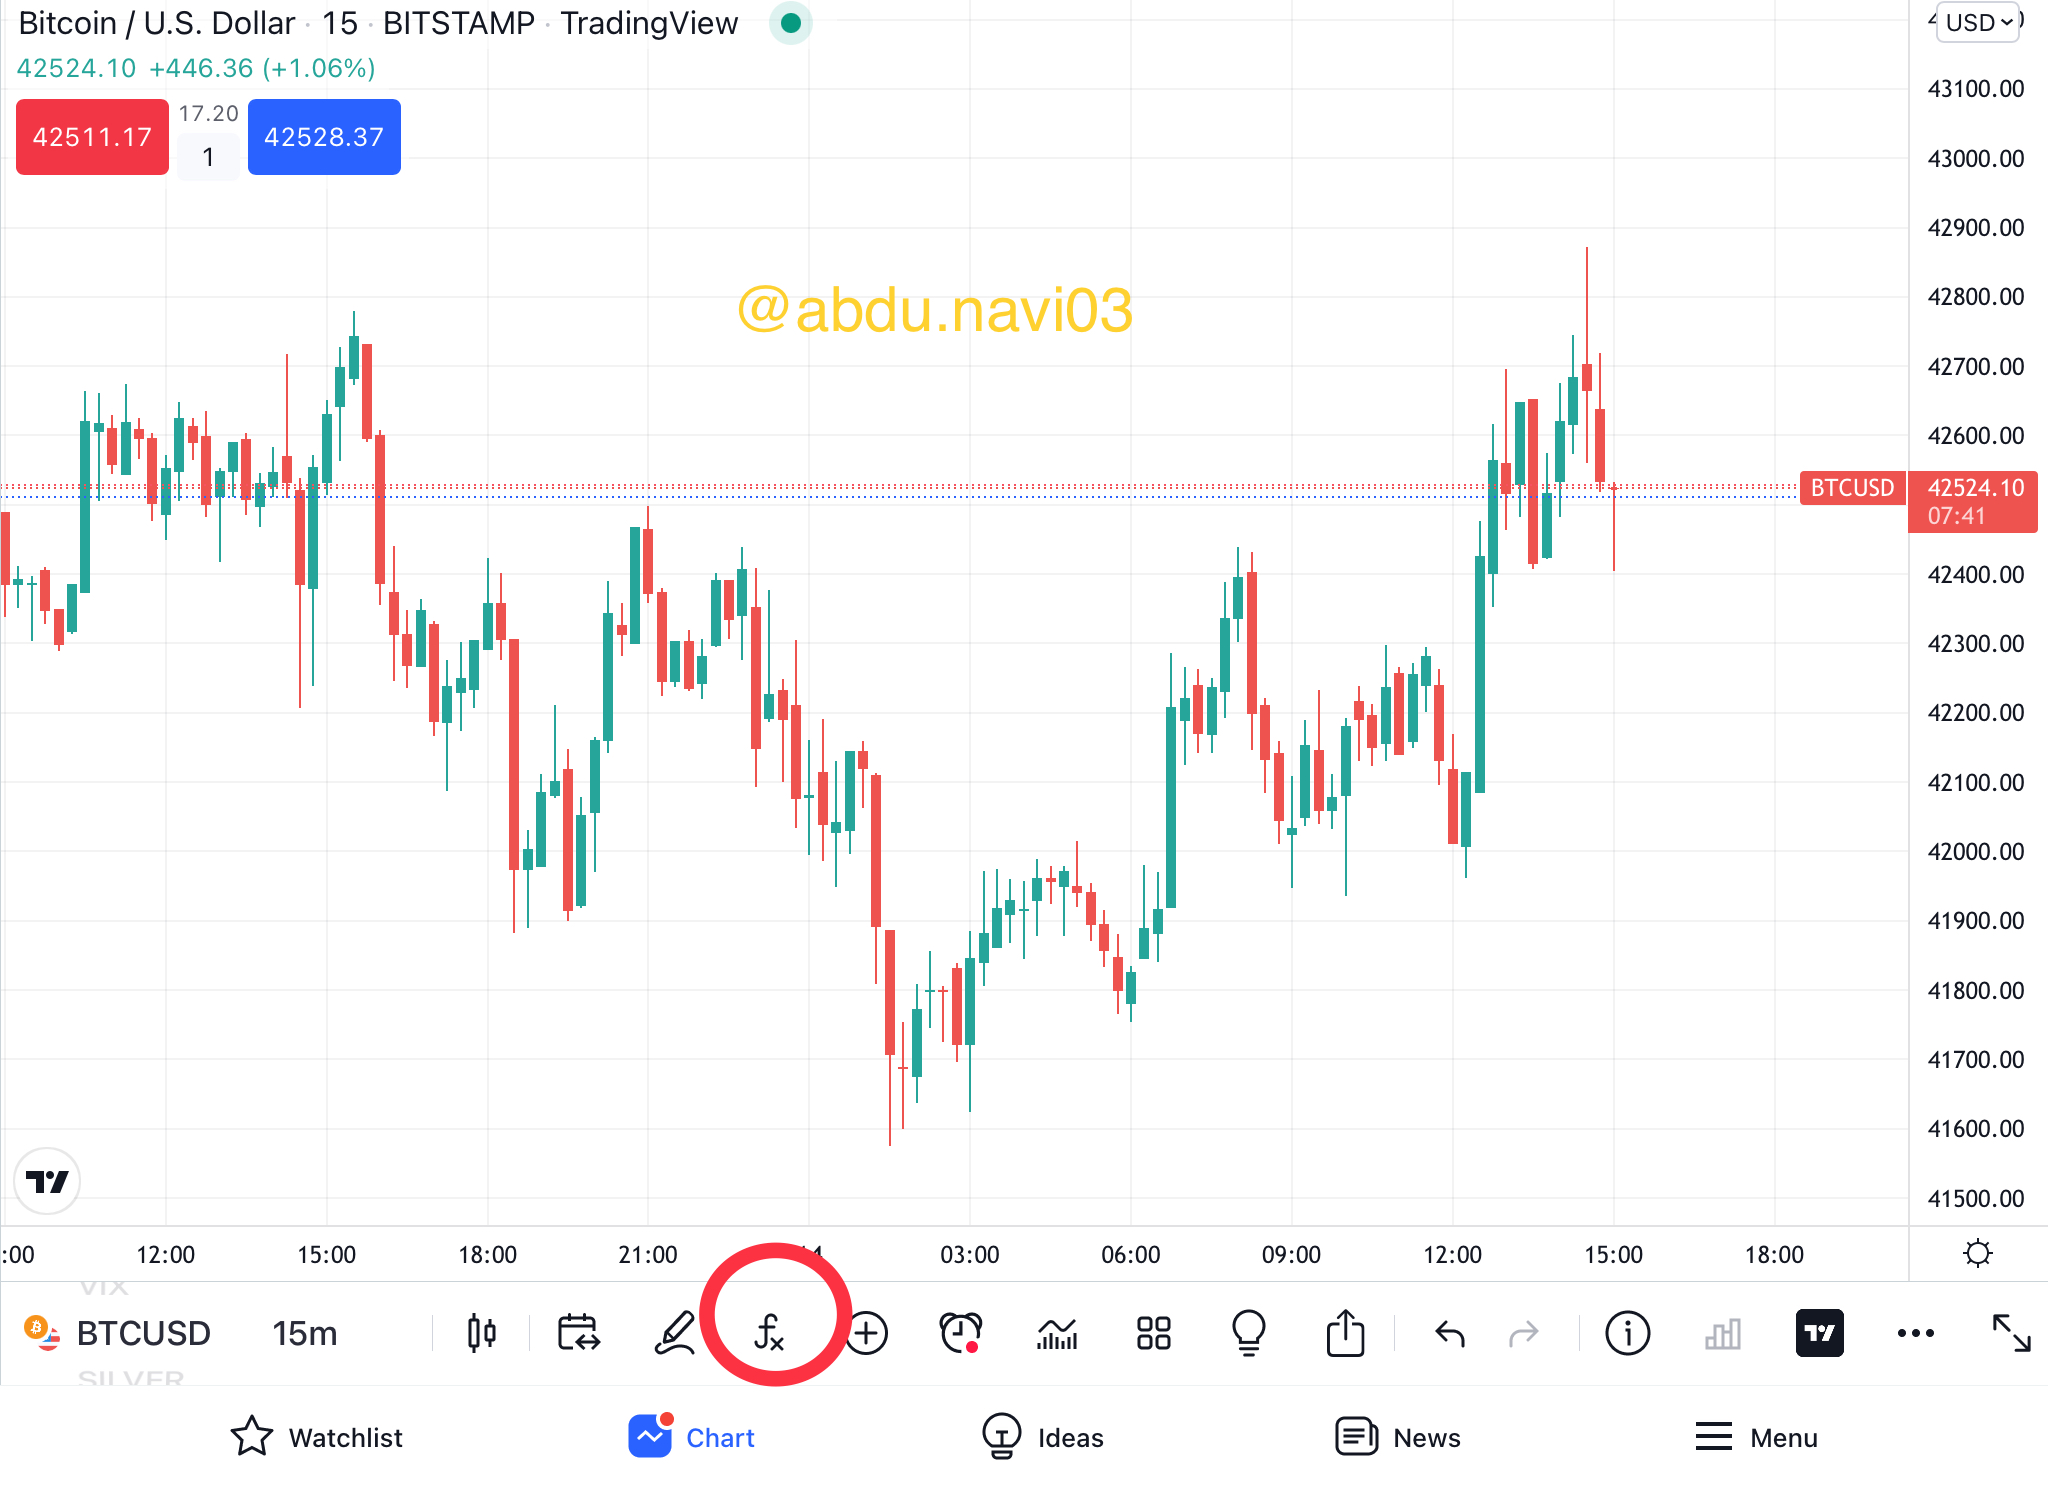
From this sign, you can open and search TEMA. To select and apply TEMA. This option is above in computer or web but it is below, like this in iPad.
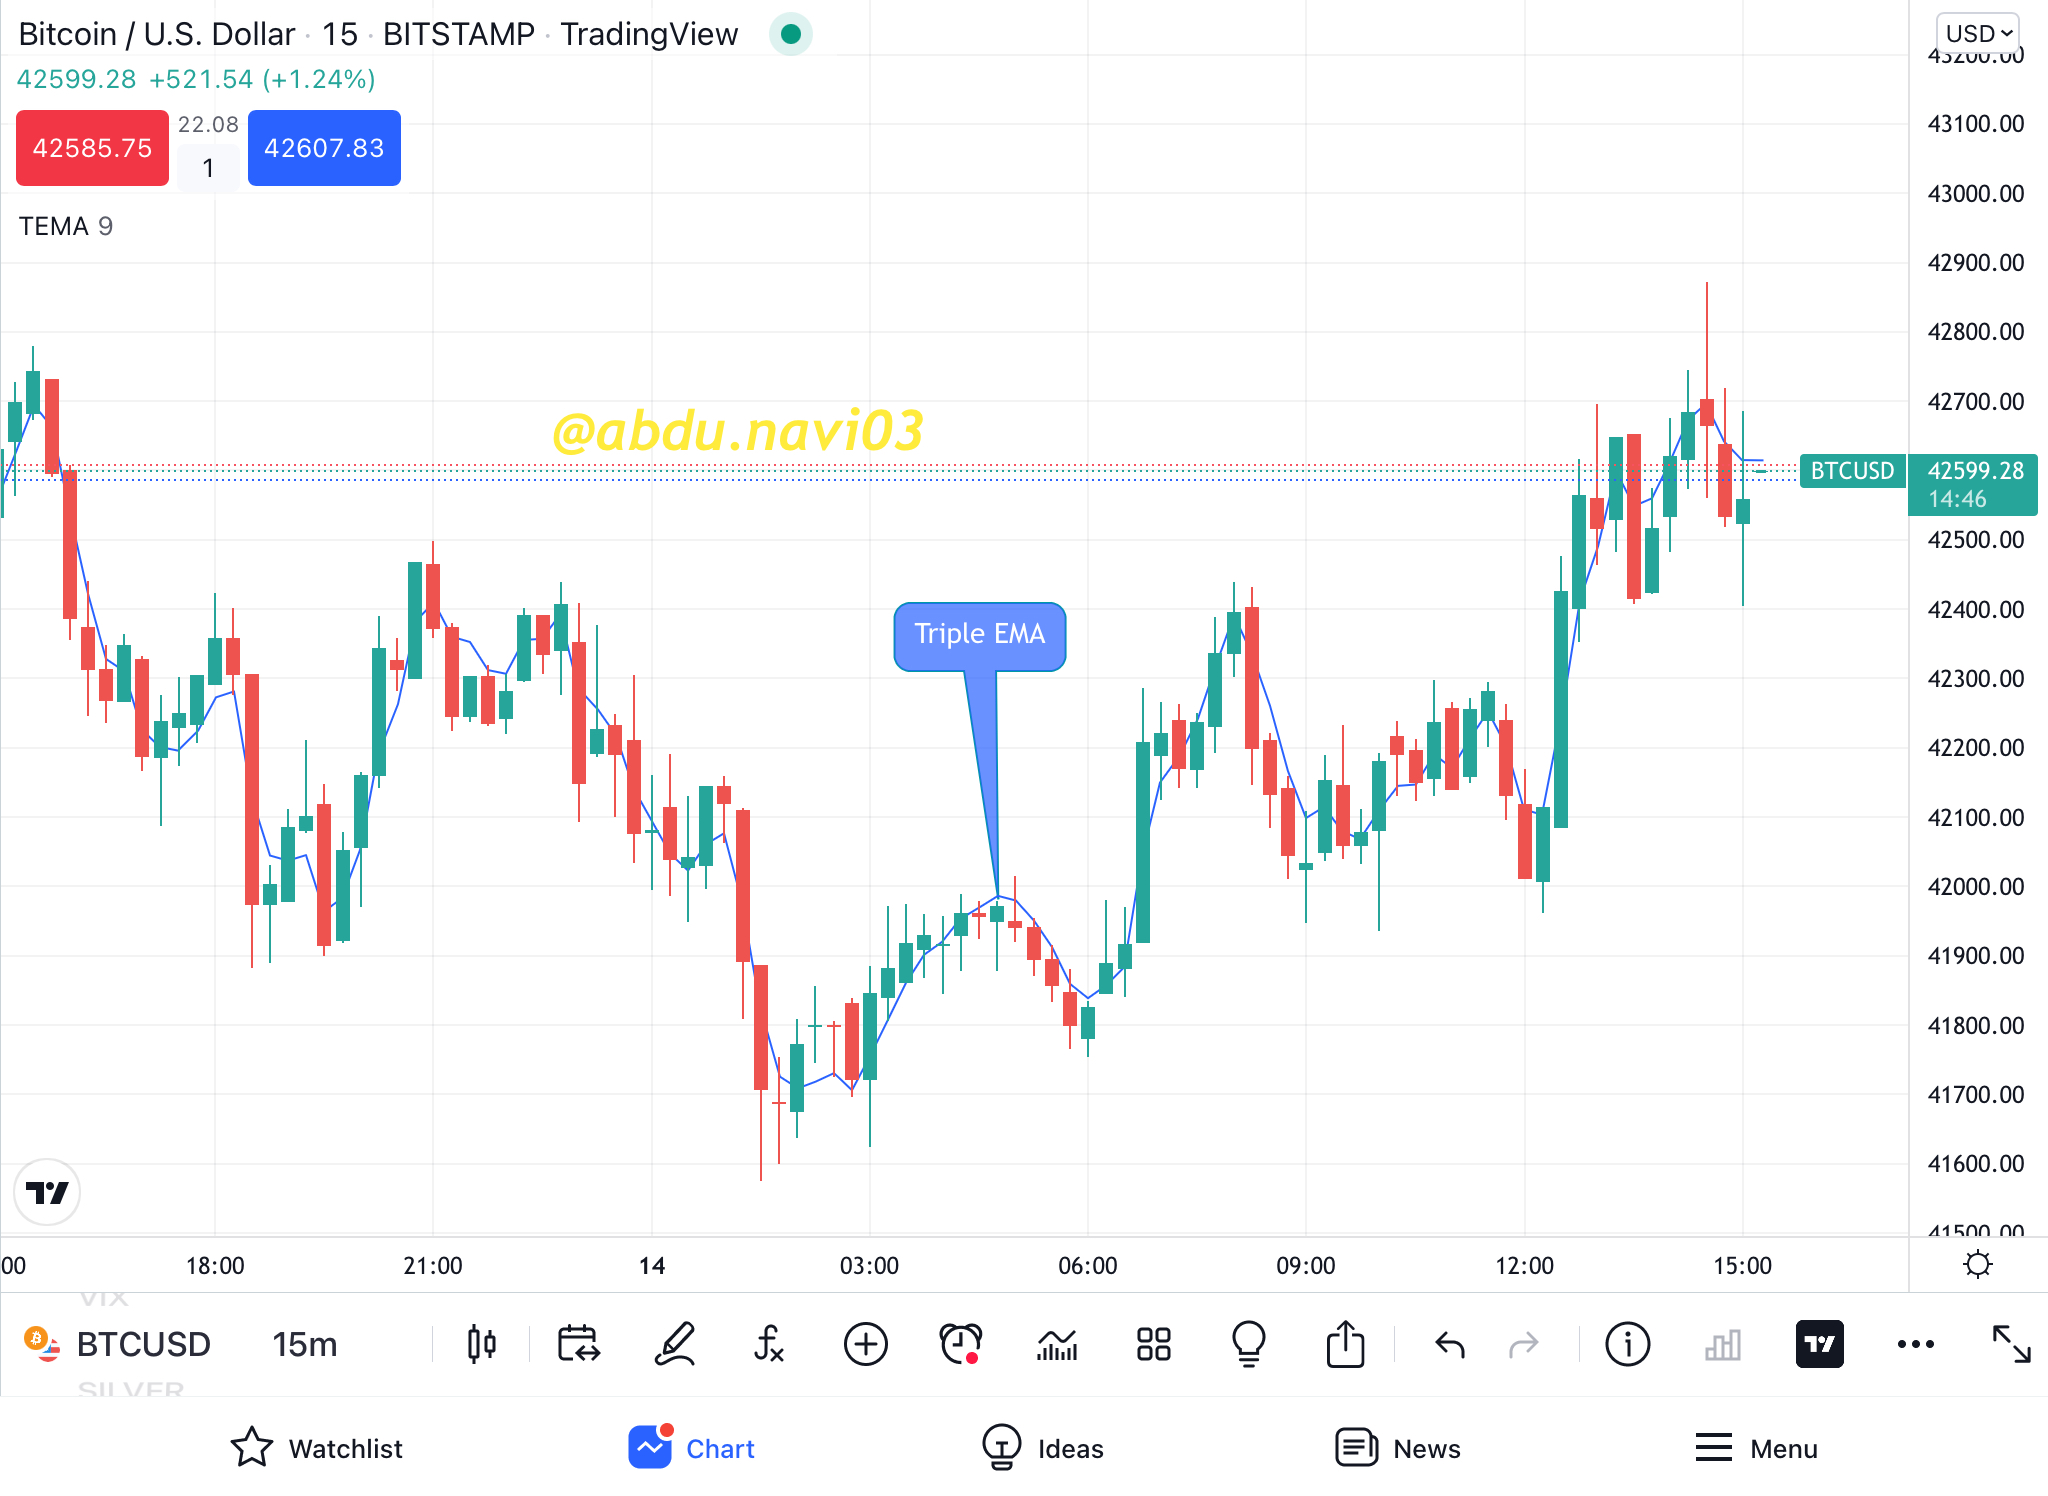
This is what TEMA looks like on the chart.
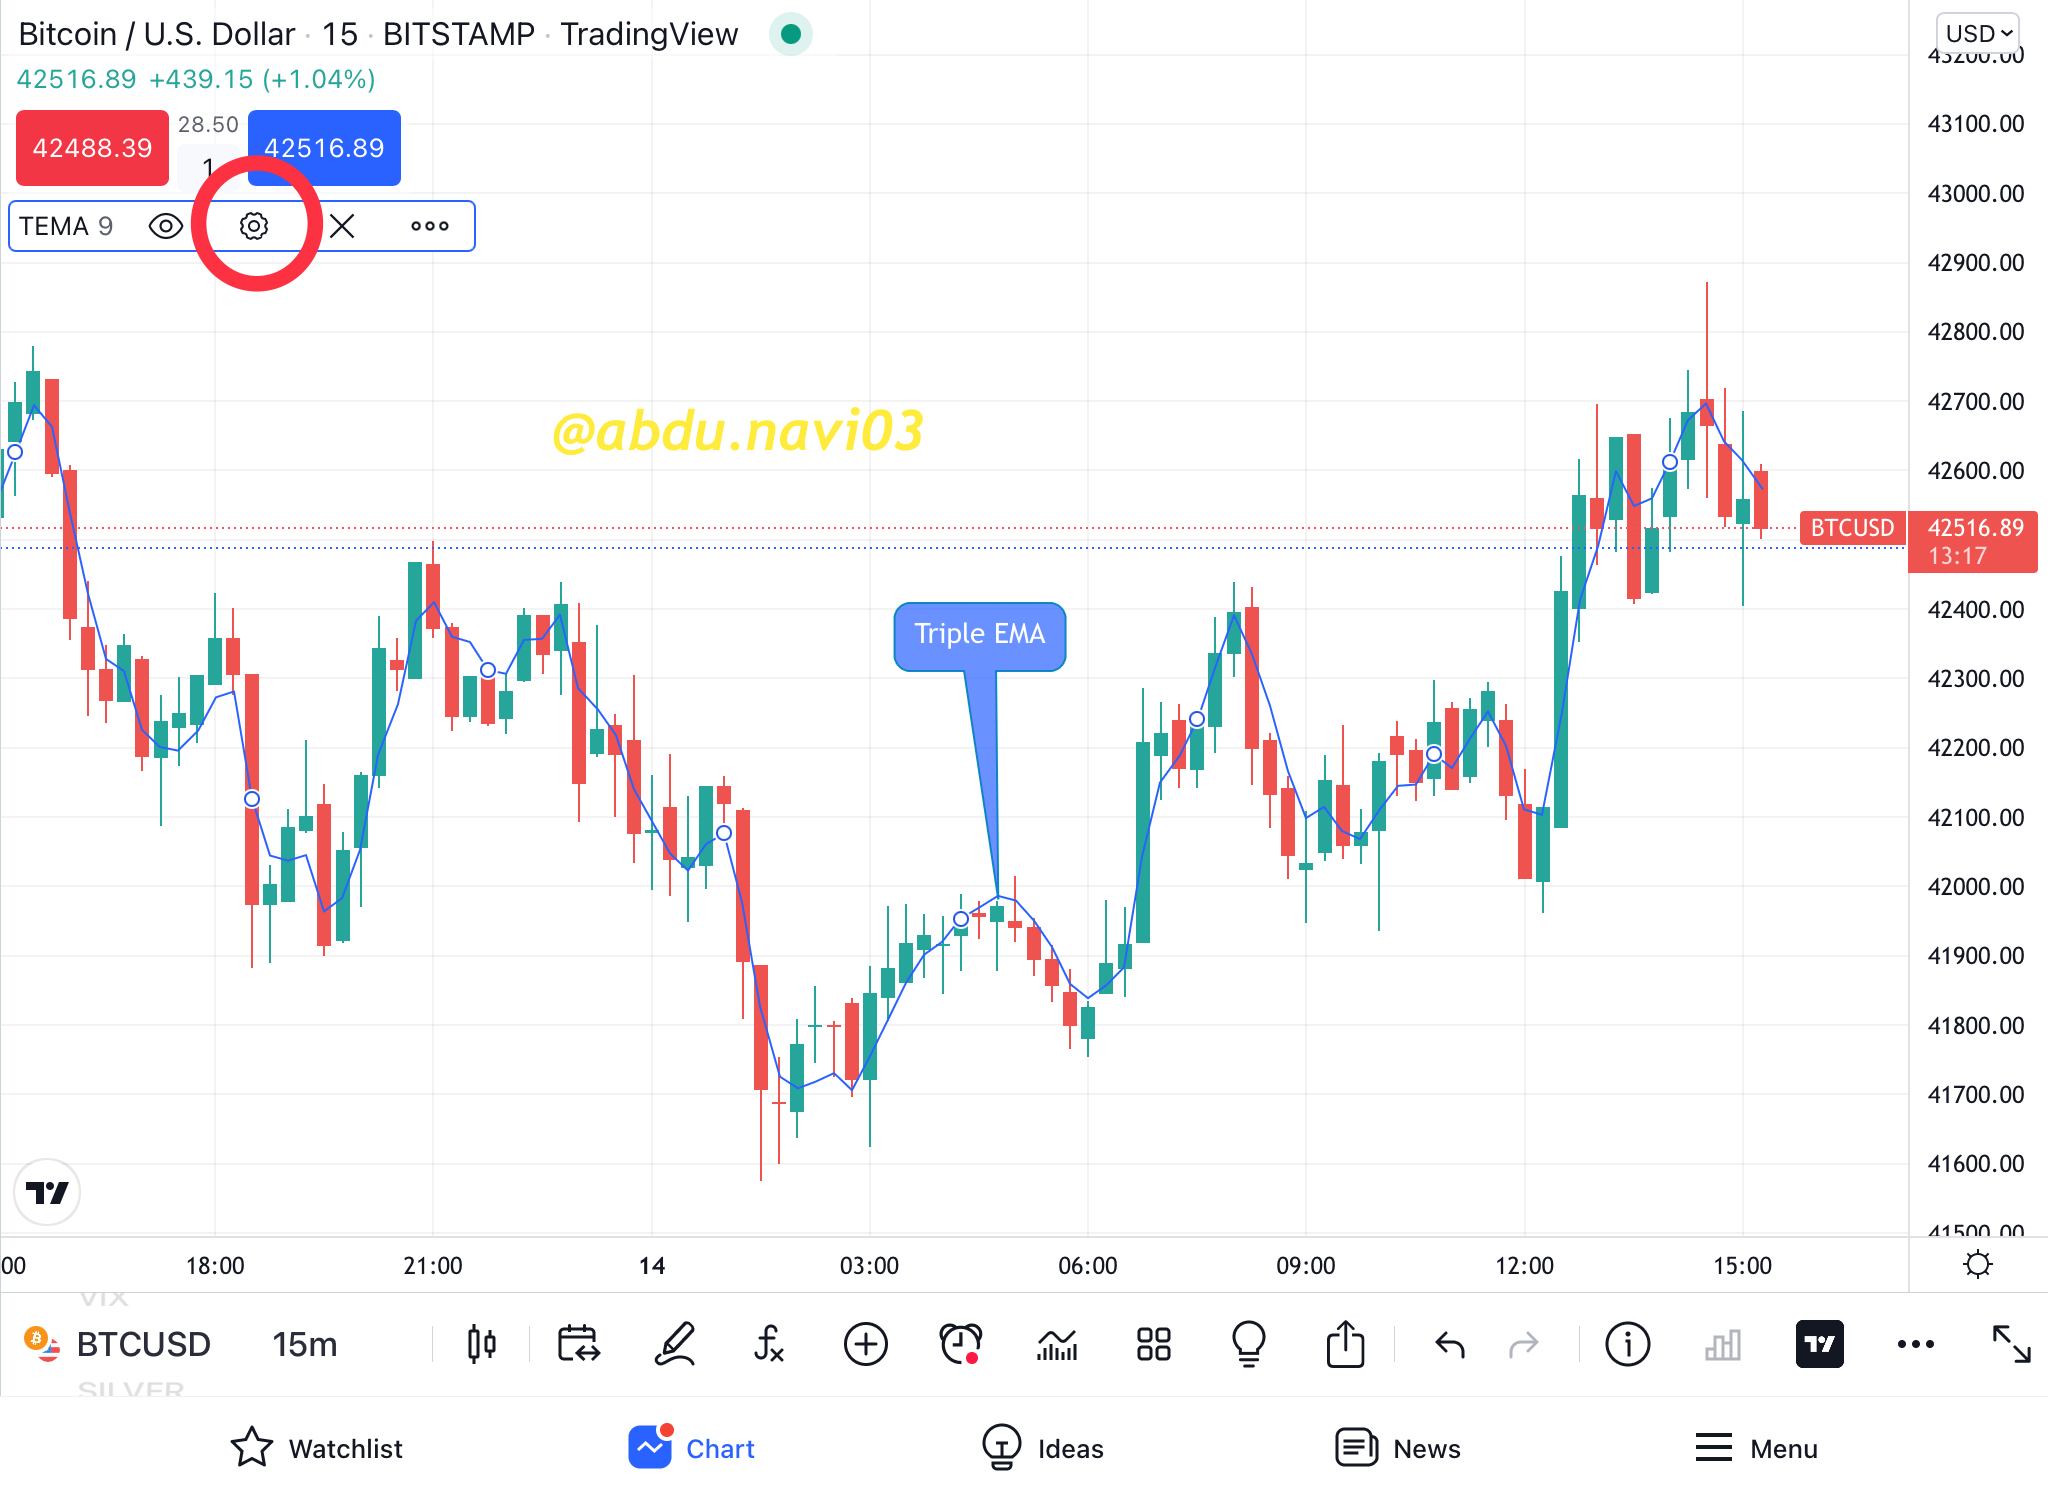
From this section, you can open and configure the settings of TEMA as you like. I will show you the difference in the chart with the difference in settings.
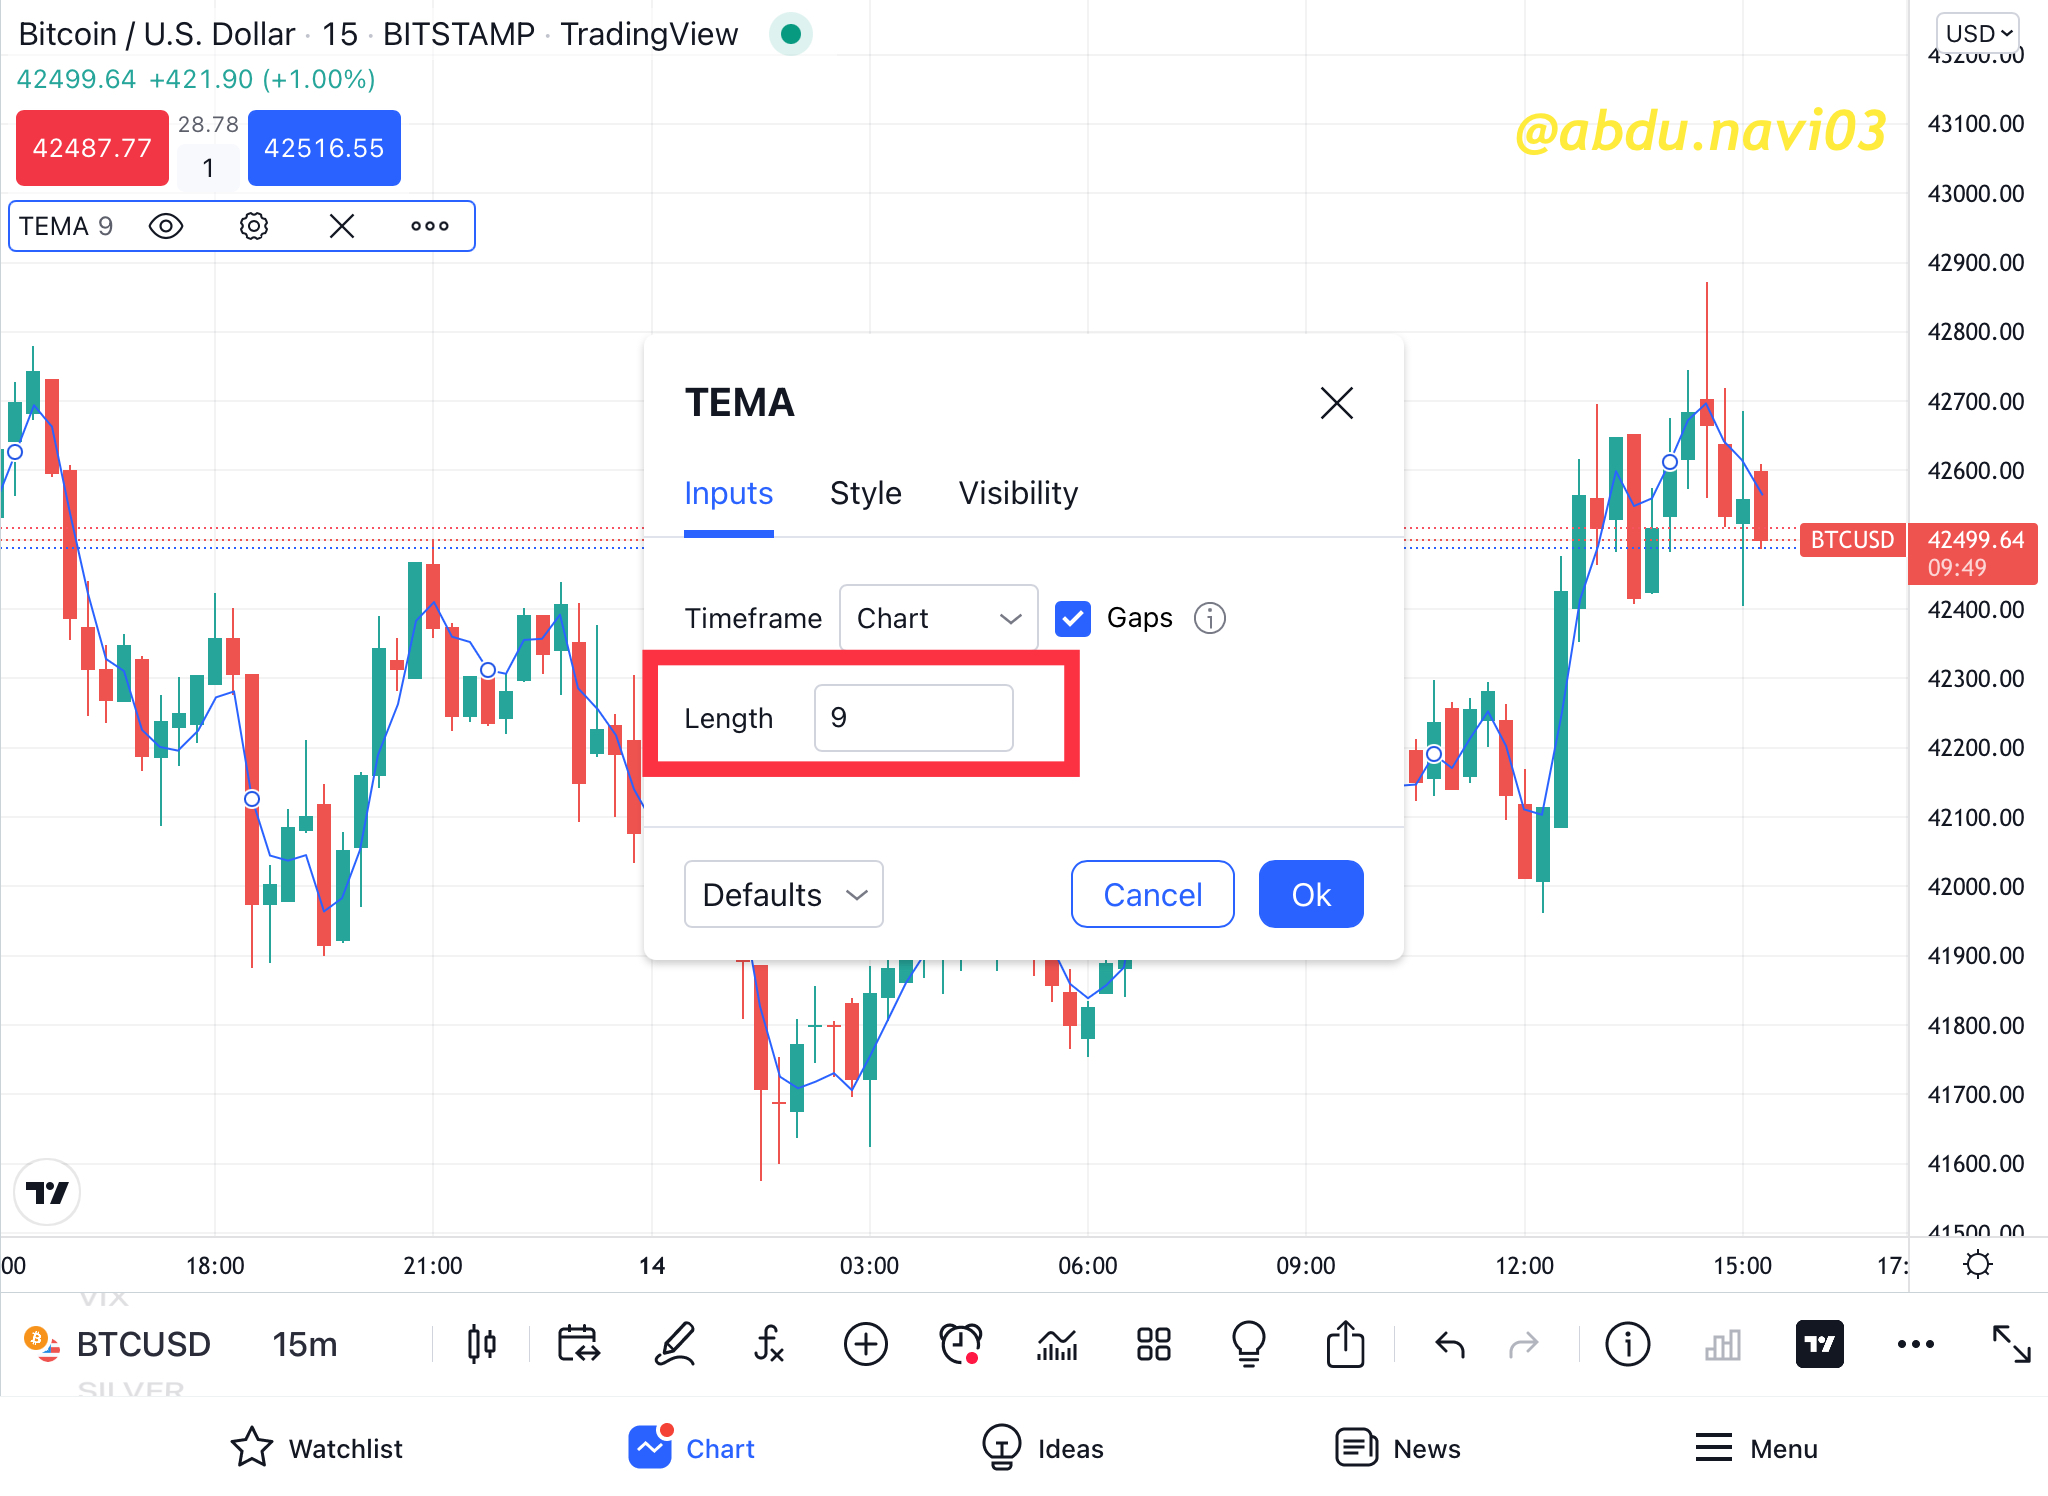
As you can see there’s only one setting that can be changed and it really matters. The length is the period of history the chart will look upon. For example, as the length is 9, the EMA will move according to 9 candles back history.
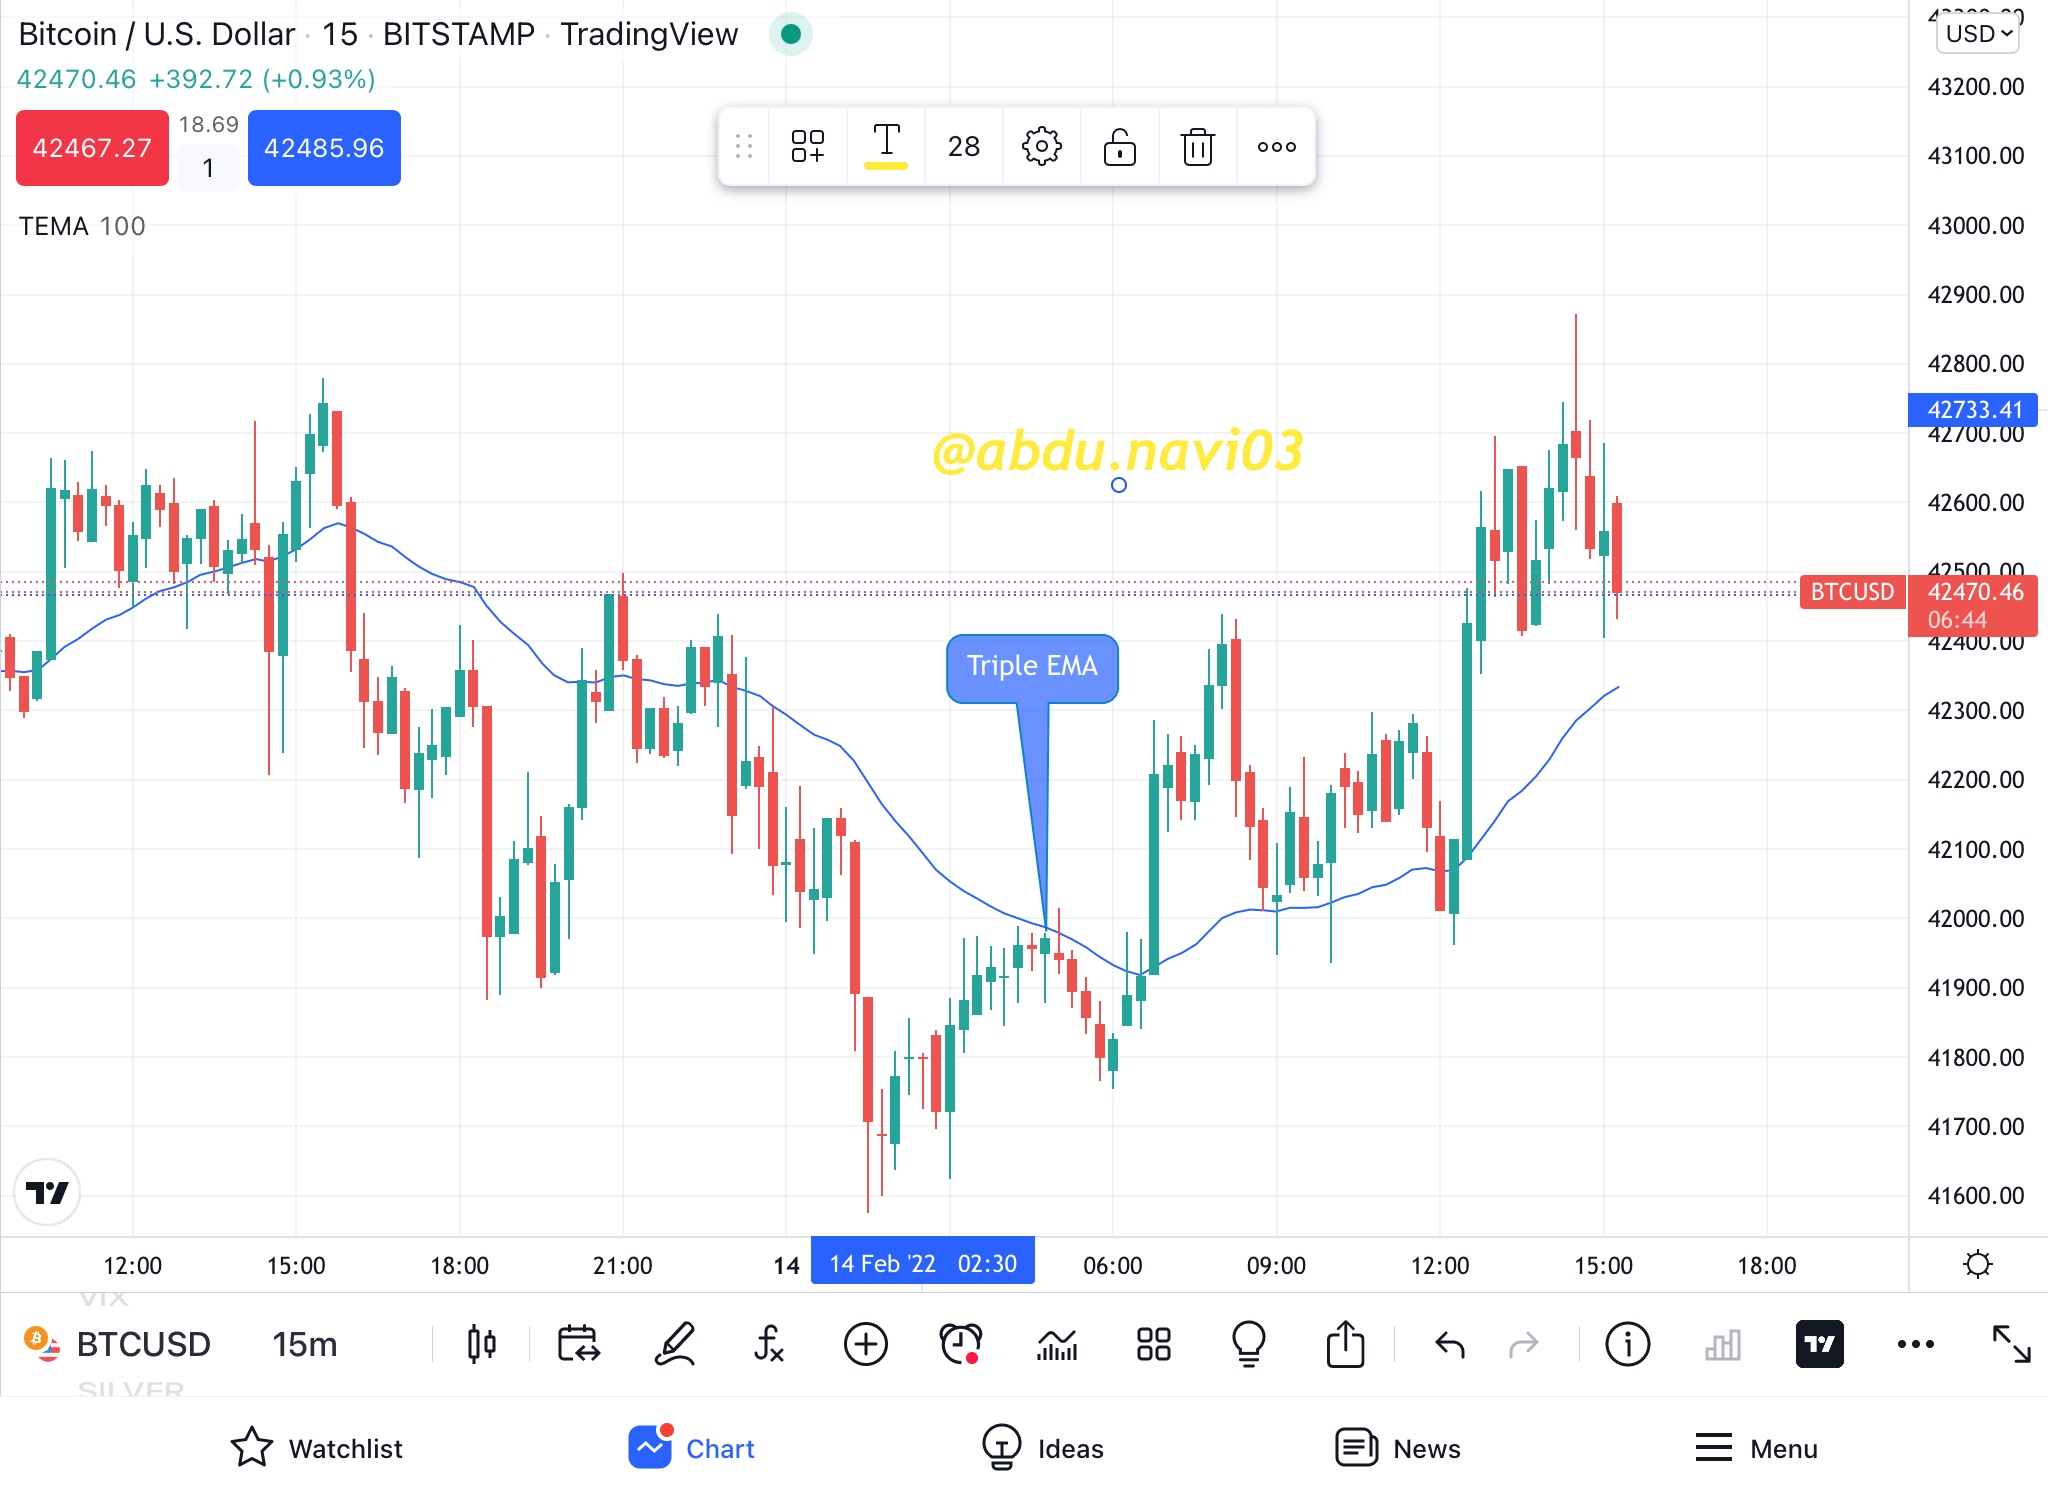
As you can see i have changed the length to 100. And the difference is very clear. TEMA moves with solidarity and gives more strong and precise signals.
TEMA is better that’s what I’m trying to state, but why? That’s the real question. So in this section, we will compare TEMA with other moving averages. I’ve chosen EMA, SMA, and WMA with TEMA.
Let’s start with SMA, Simple Moving average
The simple moving average is the average price over the period of time
TEMA is better that’s what I’m trying to state, but why? That’s the real question. So in this section, we will compare TEMA with other moving averages. I’ve chosen EMA, SMA and WMA with TEMA.
Let’s start with SMA, Simple Moving average
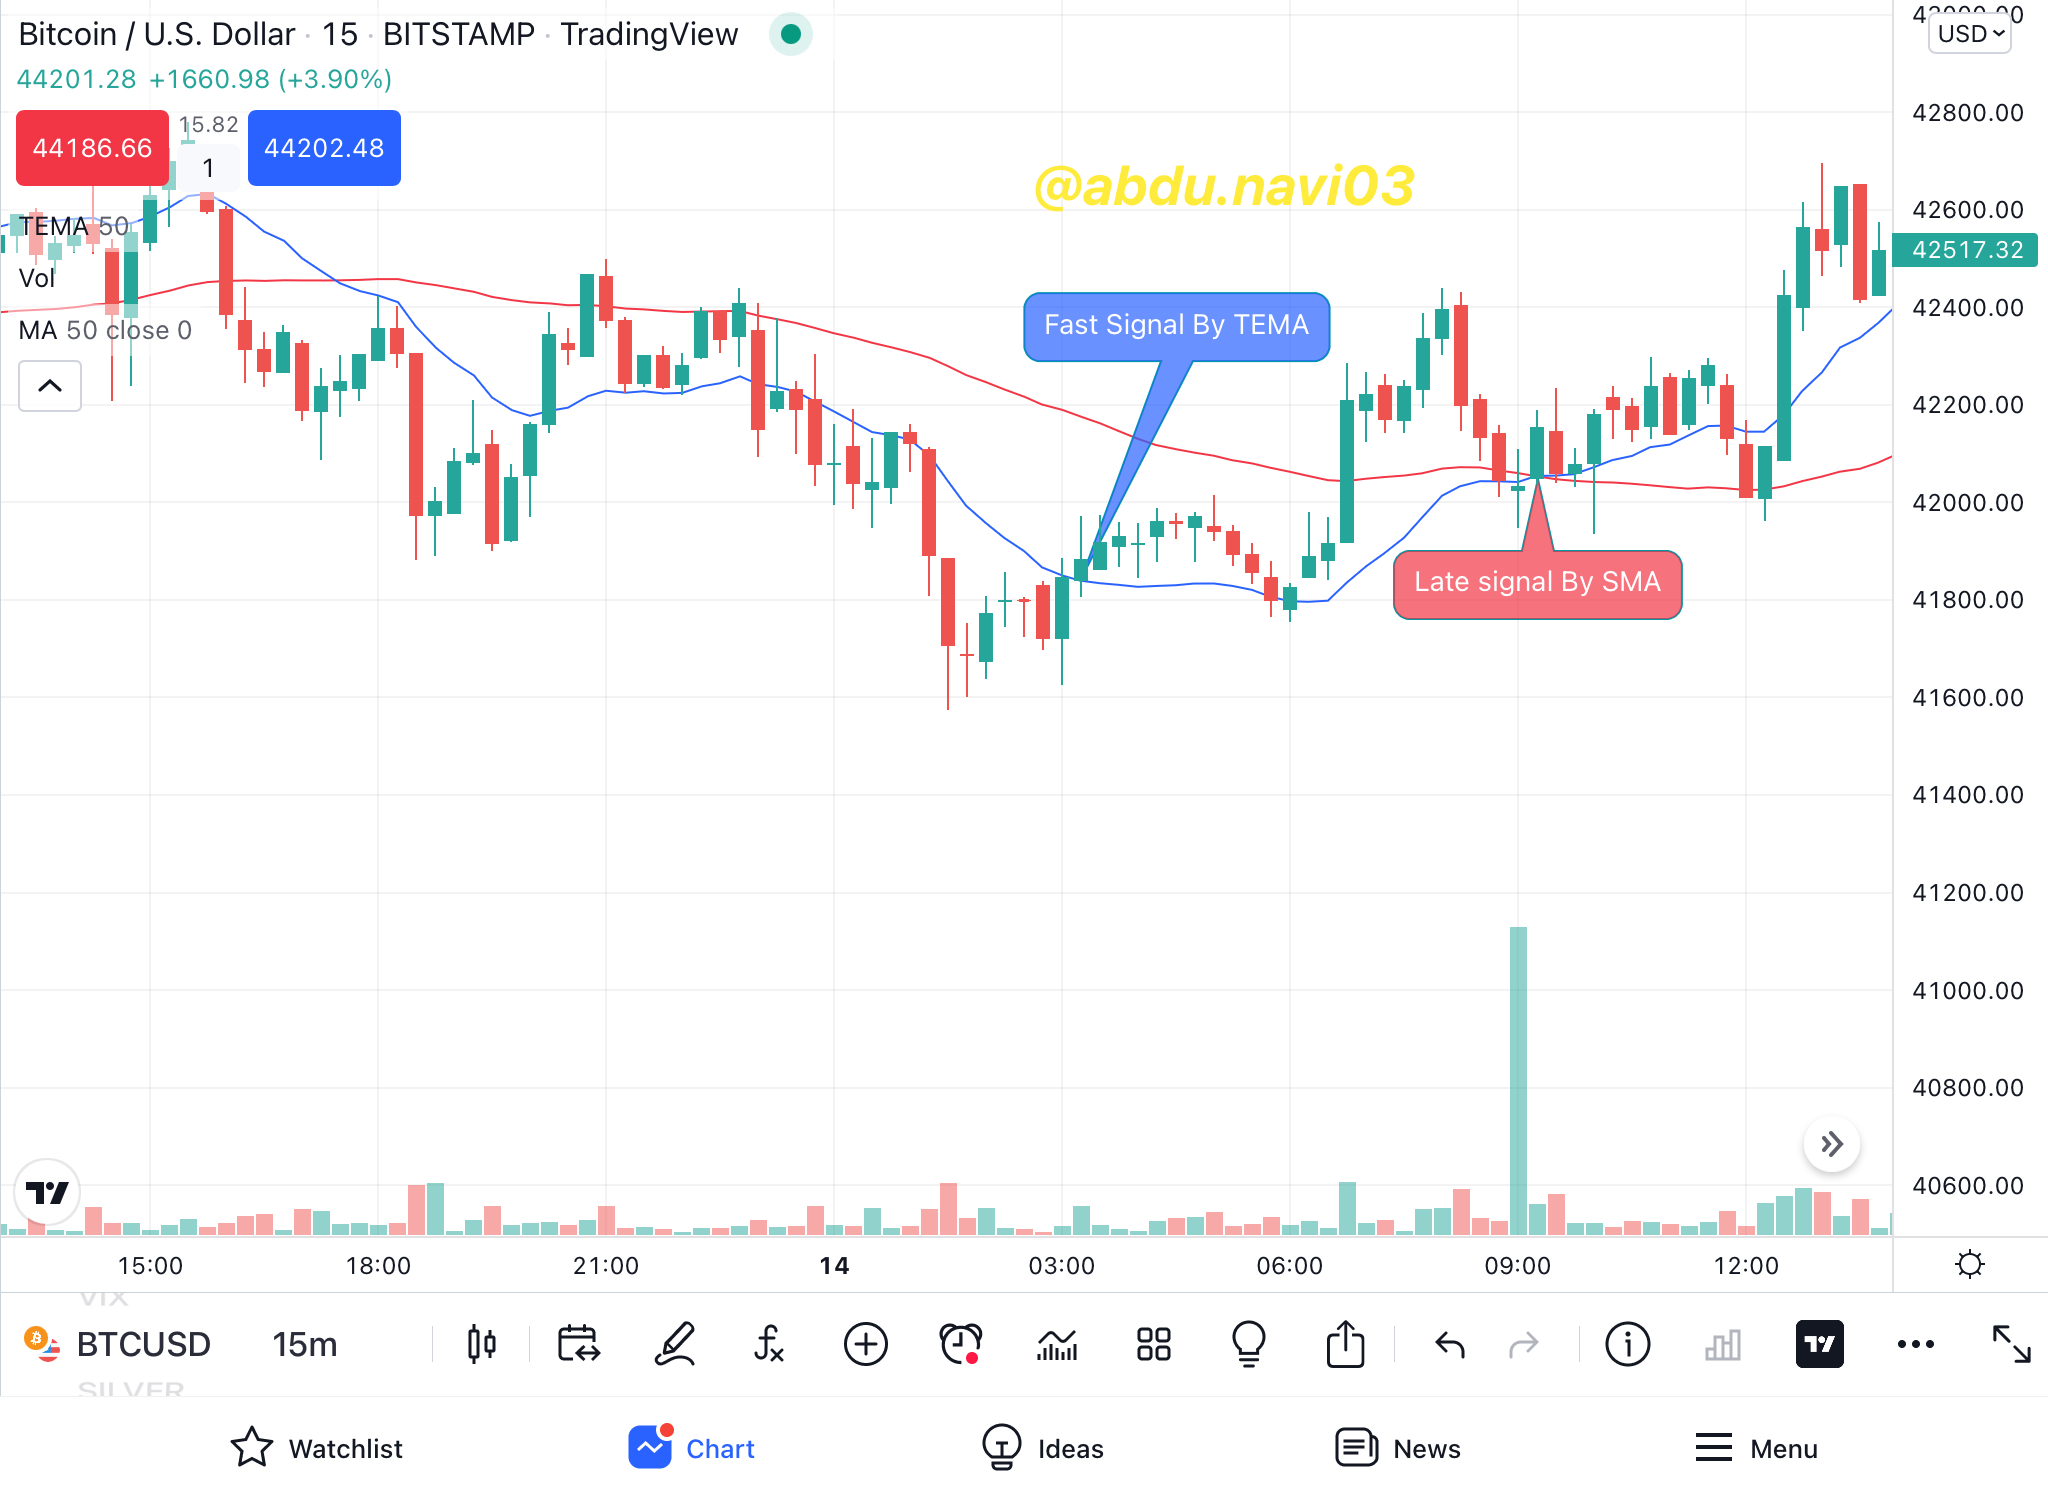
The simple moving average is the average price over the period of time and therefore it just simply shows the average price without any alteration. It results in slow movements and late entries signals. But for catching a long trend, SMA is very good and very reliable. For catching a long trend many expert traders use this with fundamental analysis. Meanwhile, I already explained how TEMA gives signal faster and yet be a very good indicator for long-term trends.
The trend reversal by SMA is indicated very late, meanwhile, the fast movement of TEMA indicates trend reversal better.
EMA stands for the exponential moving average.
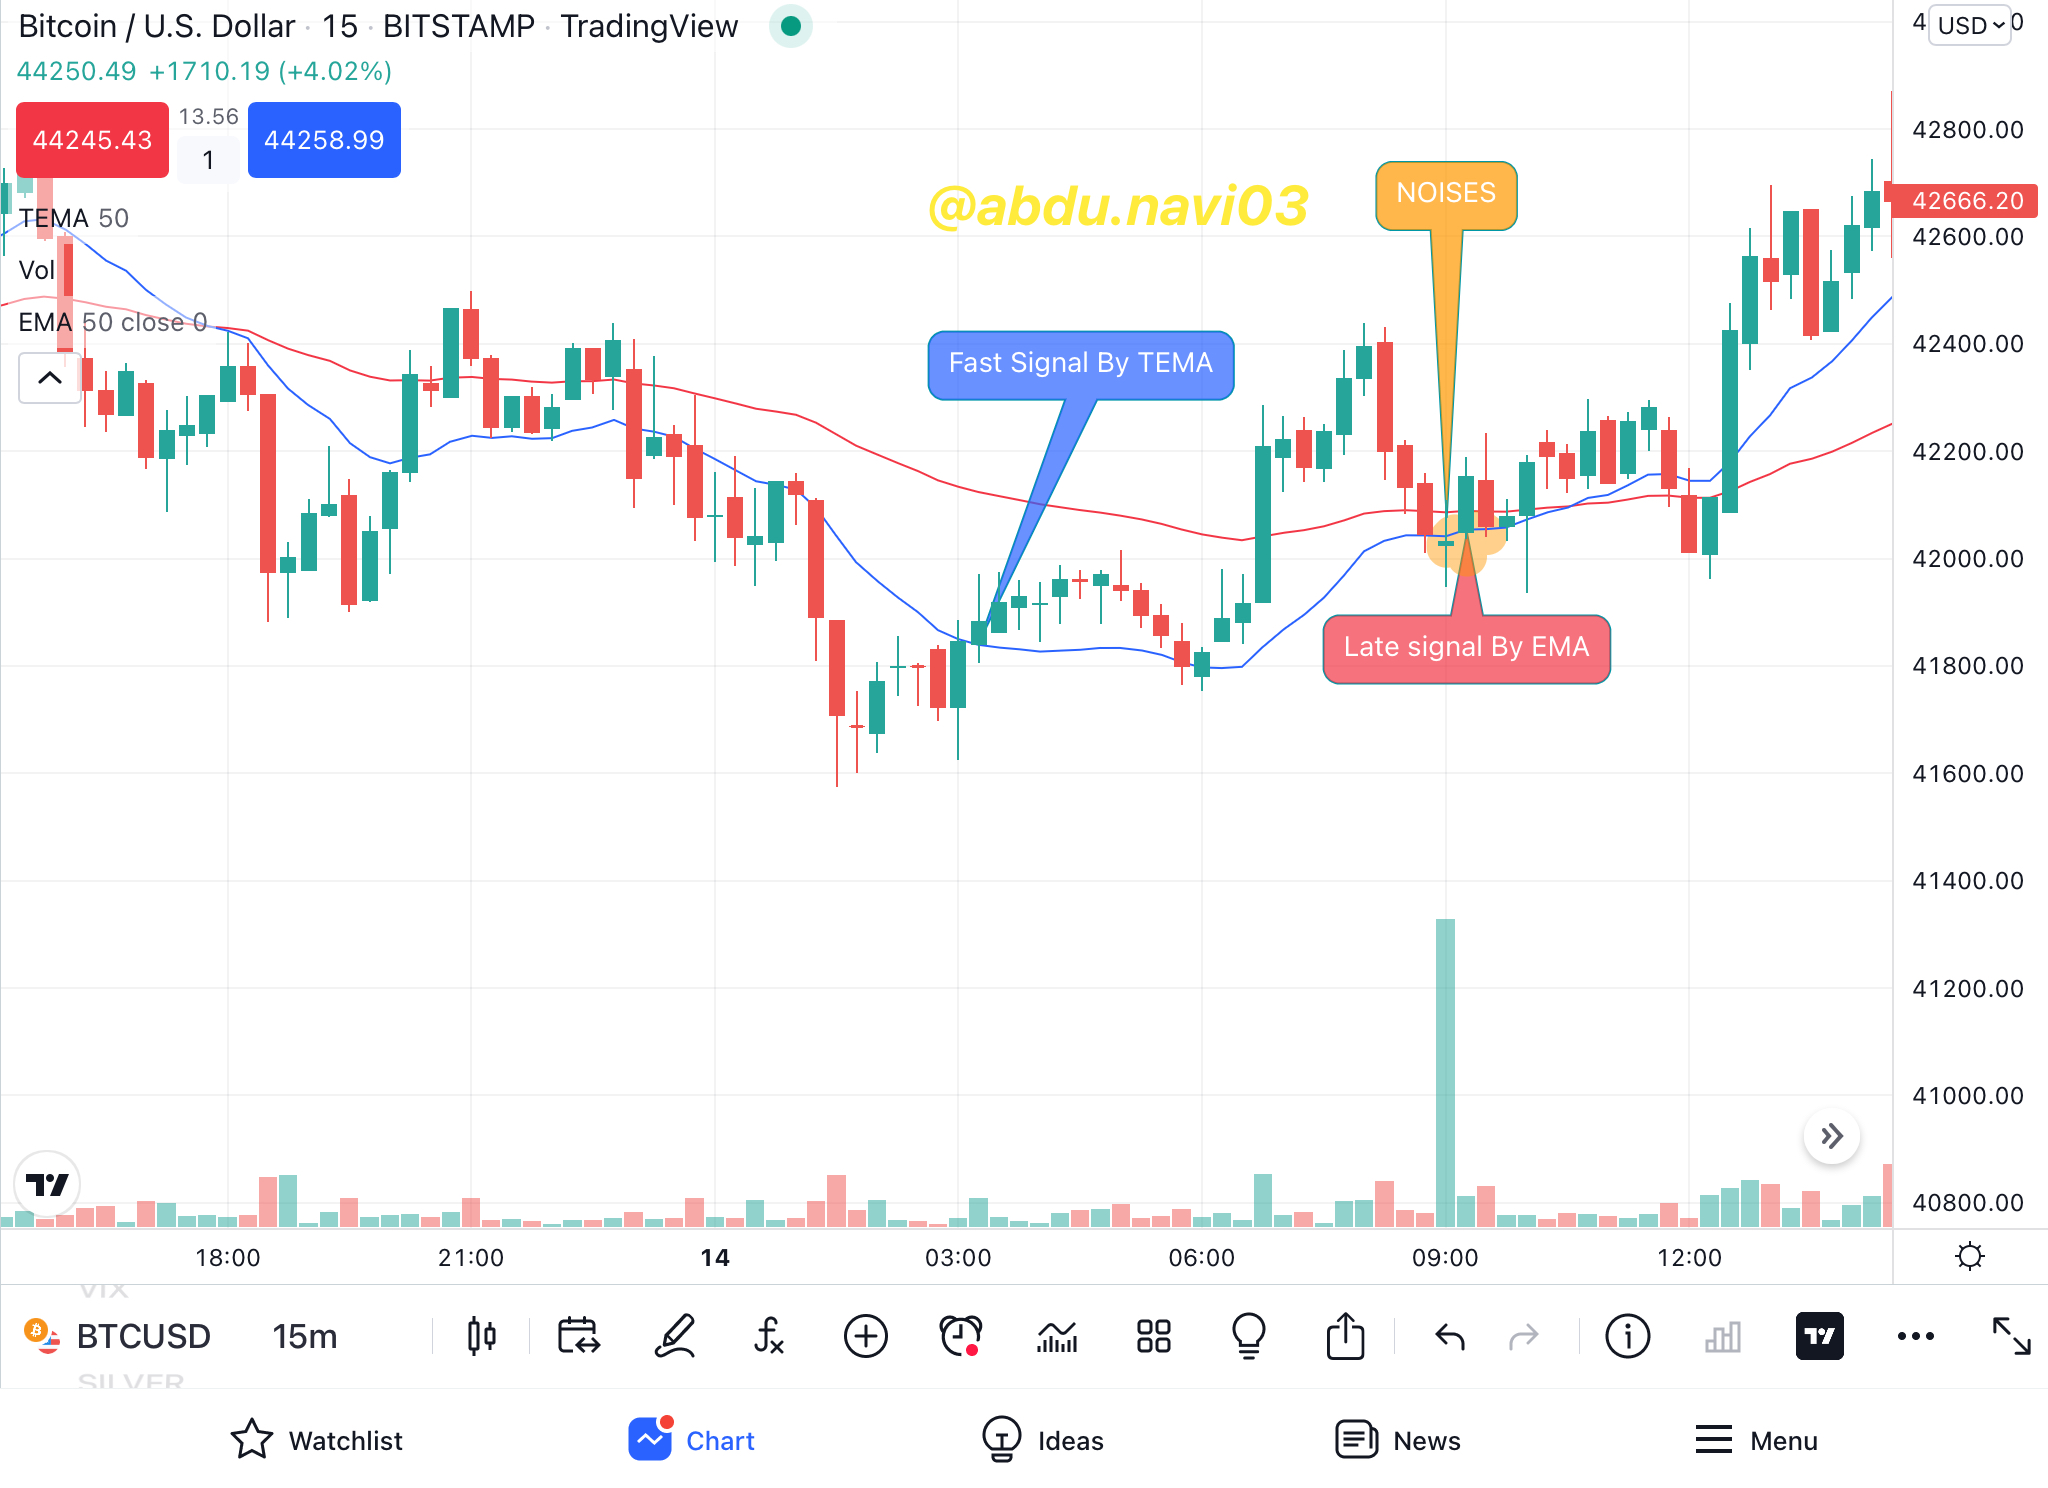
EMA usually focuses present not the past. It sticks close to the price, compare to SMA, and it's quite fast than SMA too. It gives present price movements but to avoid noises and false trend signals it also does smoothing to the indication. Yet somehow it is unable to remove all the noises from the price chart. There we need TEMA, TEMA can filter what EMA can’t. EMA unlike SMA is better with low length as it relies on current value and trends and it is very good in catching reversals
WMA stands for Weighted moving average
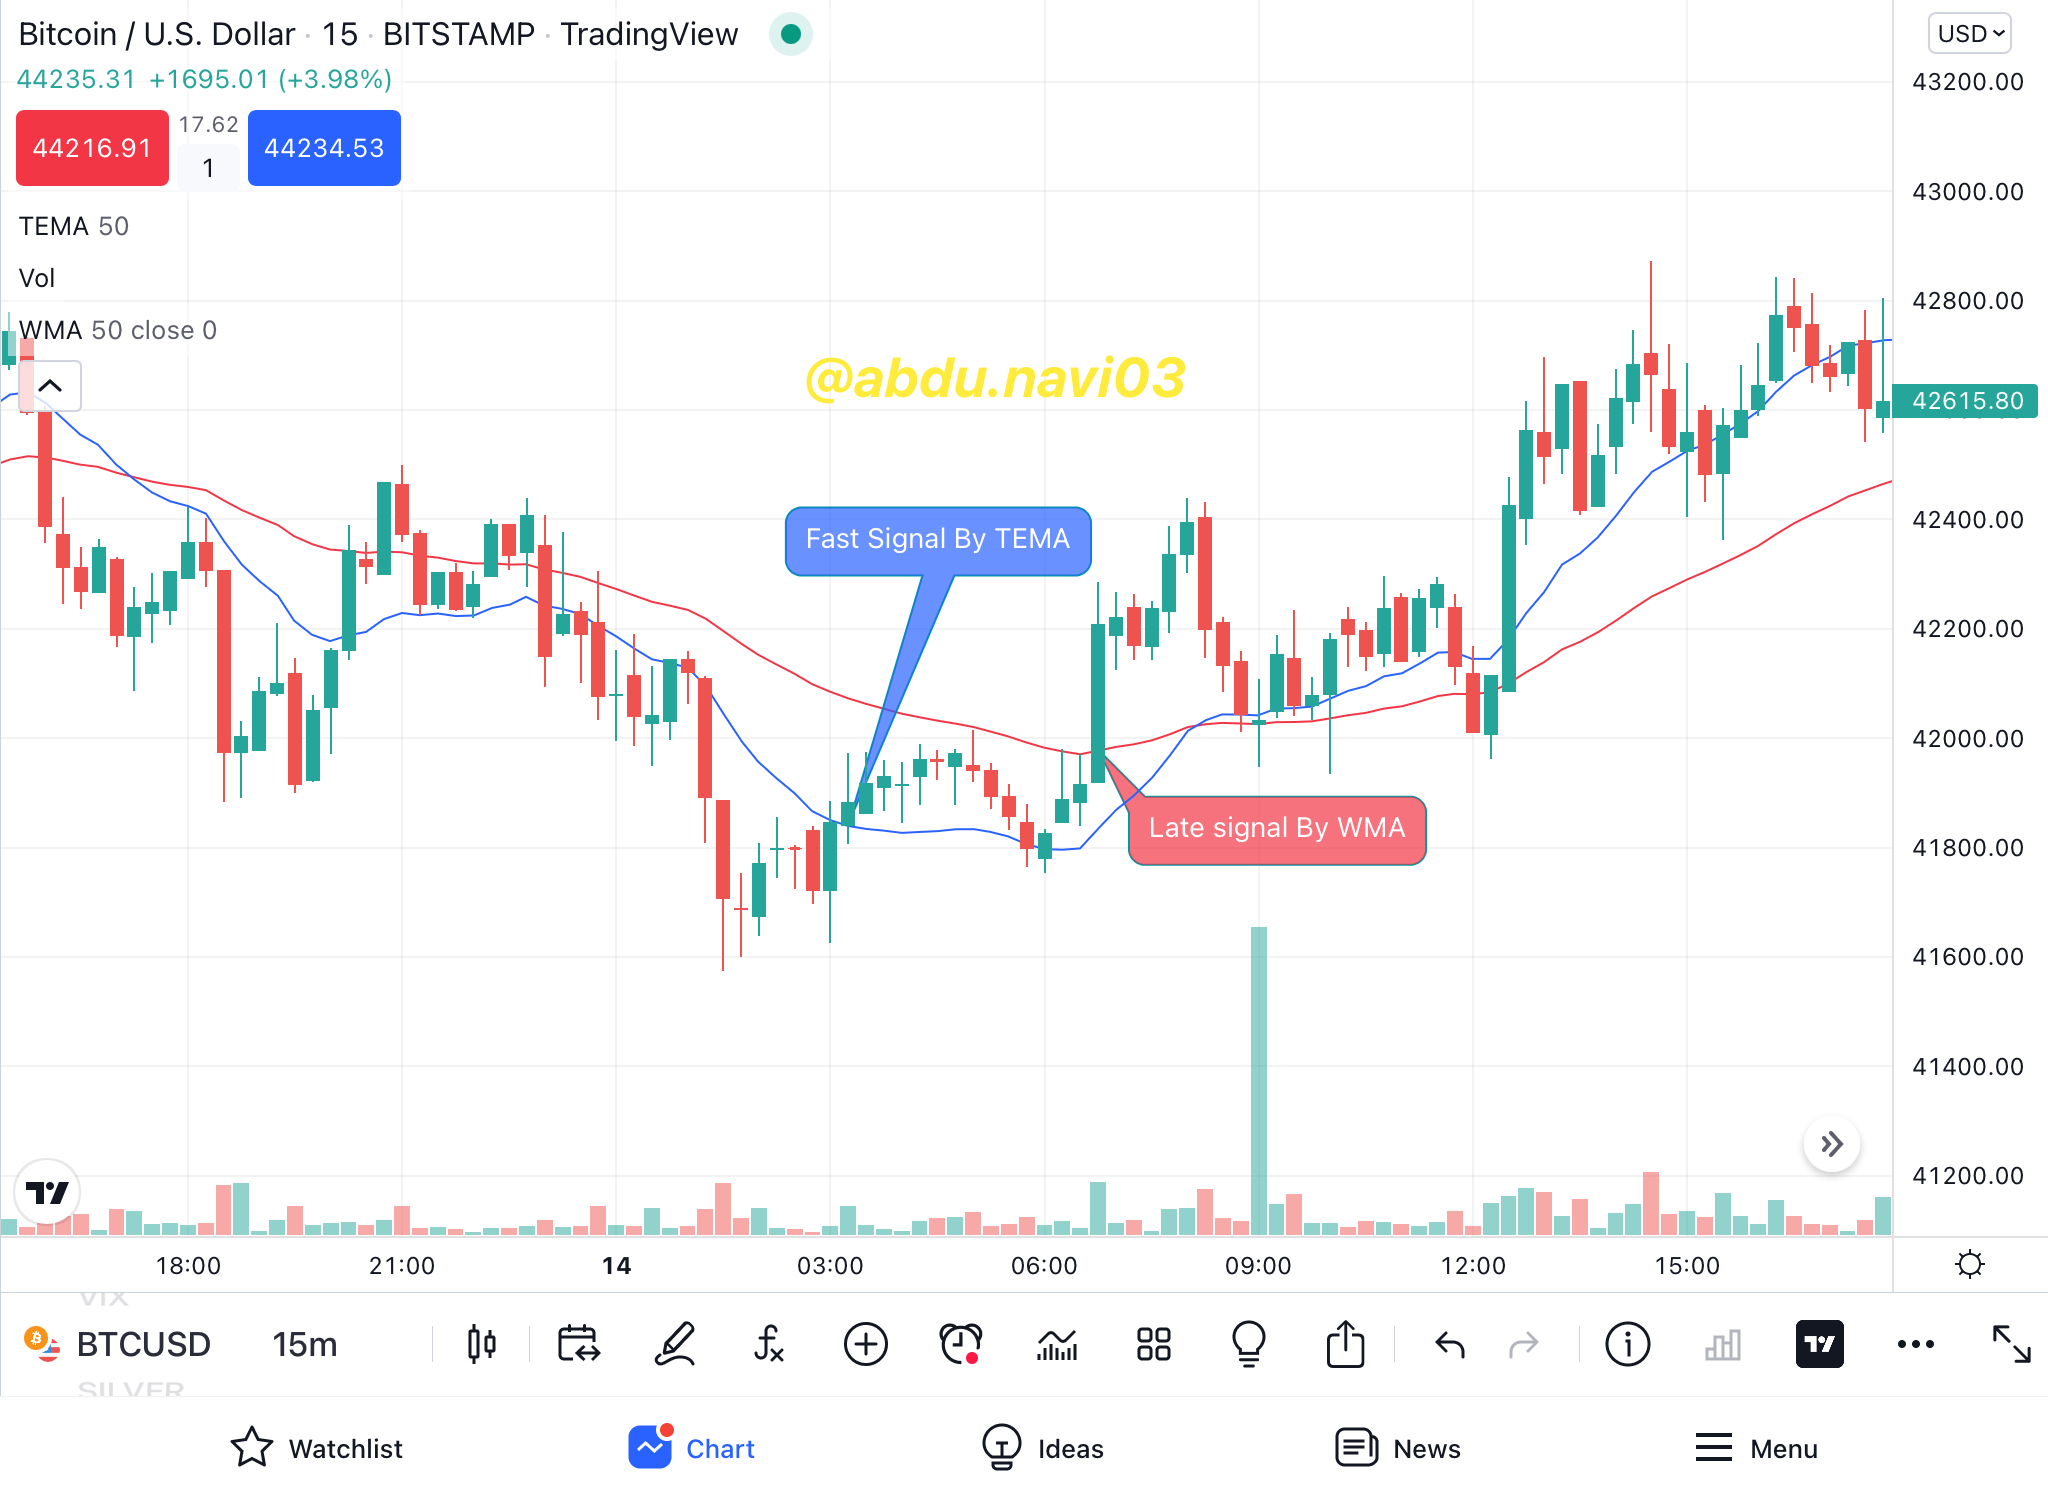
It relies on recent data. The difference between EMA and WMA is that EMA yet focuses on trend meanwhile WMA focus on the most recent candles and try to indicate a signal with the illustration of new candles. To predict the market it is better than EMA but to predict a trend EMA is still better. Although it can be used in both lengths, high and low, it usually stays mediocre by the traders and uses as the confirmation signal of the indications of other indicators. TEMA, on the other hand, does give proper buy and sell identification, while WMA is just a sideways market indicator when price oscillates through it smoothly.
Attach the screenshot with the respective explanation, please.
TREND IDENTIFICATION
TEMA just like any other moving average indicator is mainly a trend identification indicator. The gig is the same but the movement is not.
For trend identification, the price’s behavior across the moving average line matters the most. Why is that? Because in bullish trend identification it might happen that one or two big candle forms but they failed to carry in a long term trend because of short volume, in this situation TEMA line will be the guardian angel and indicate the fall of price quickly, compare to other trend identification indicator moving averages, without any noise of course.
BULLISH TREND
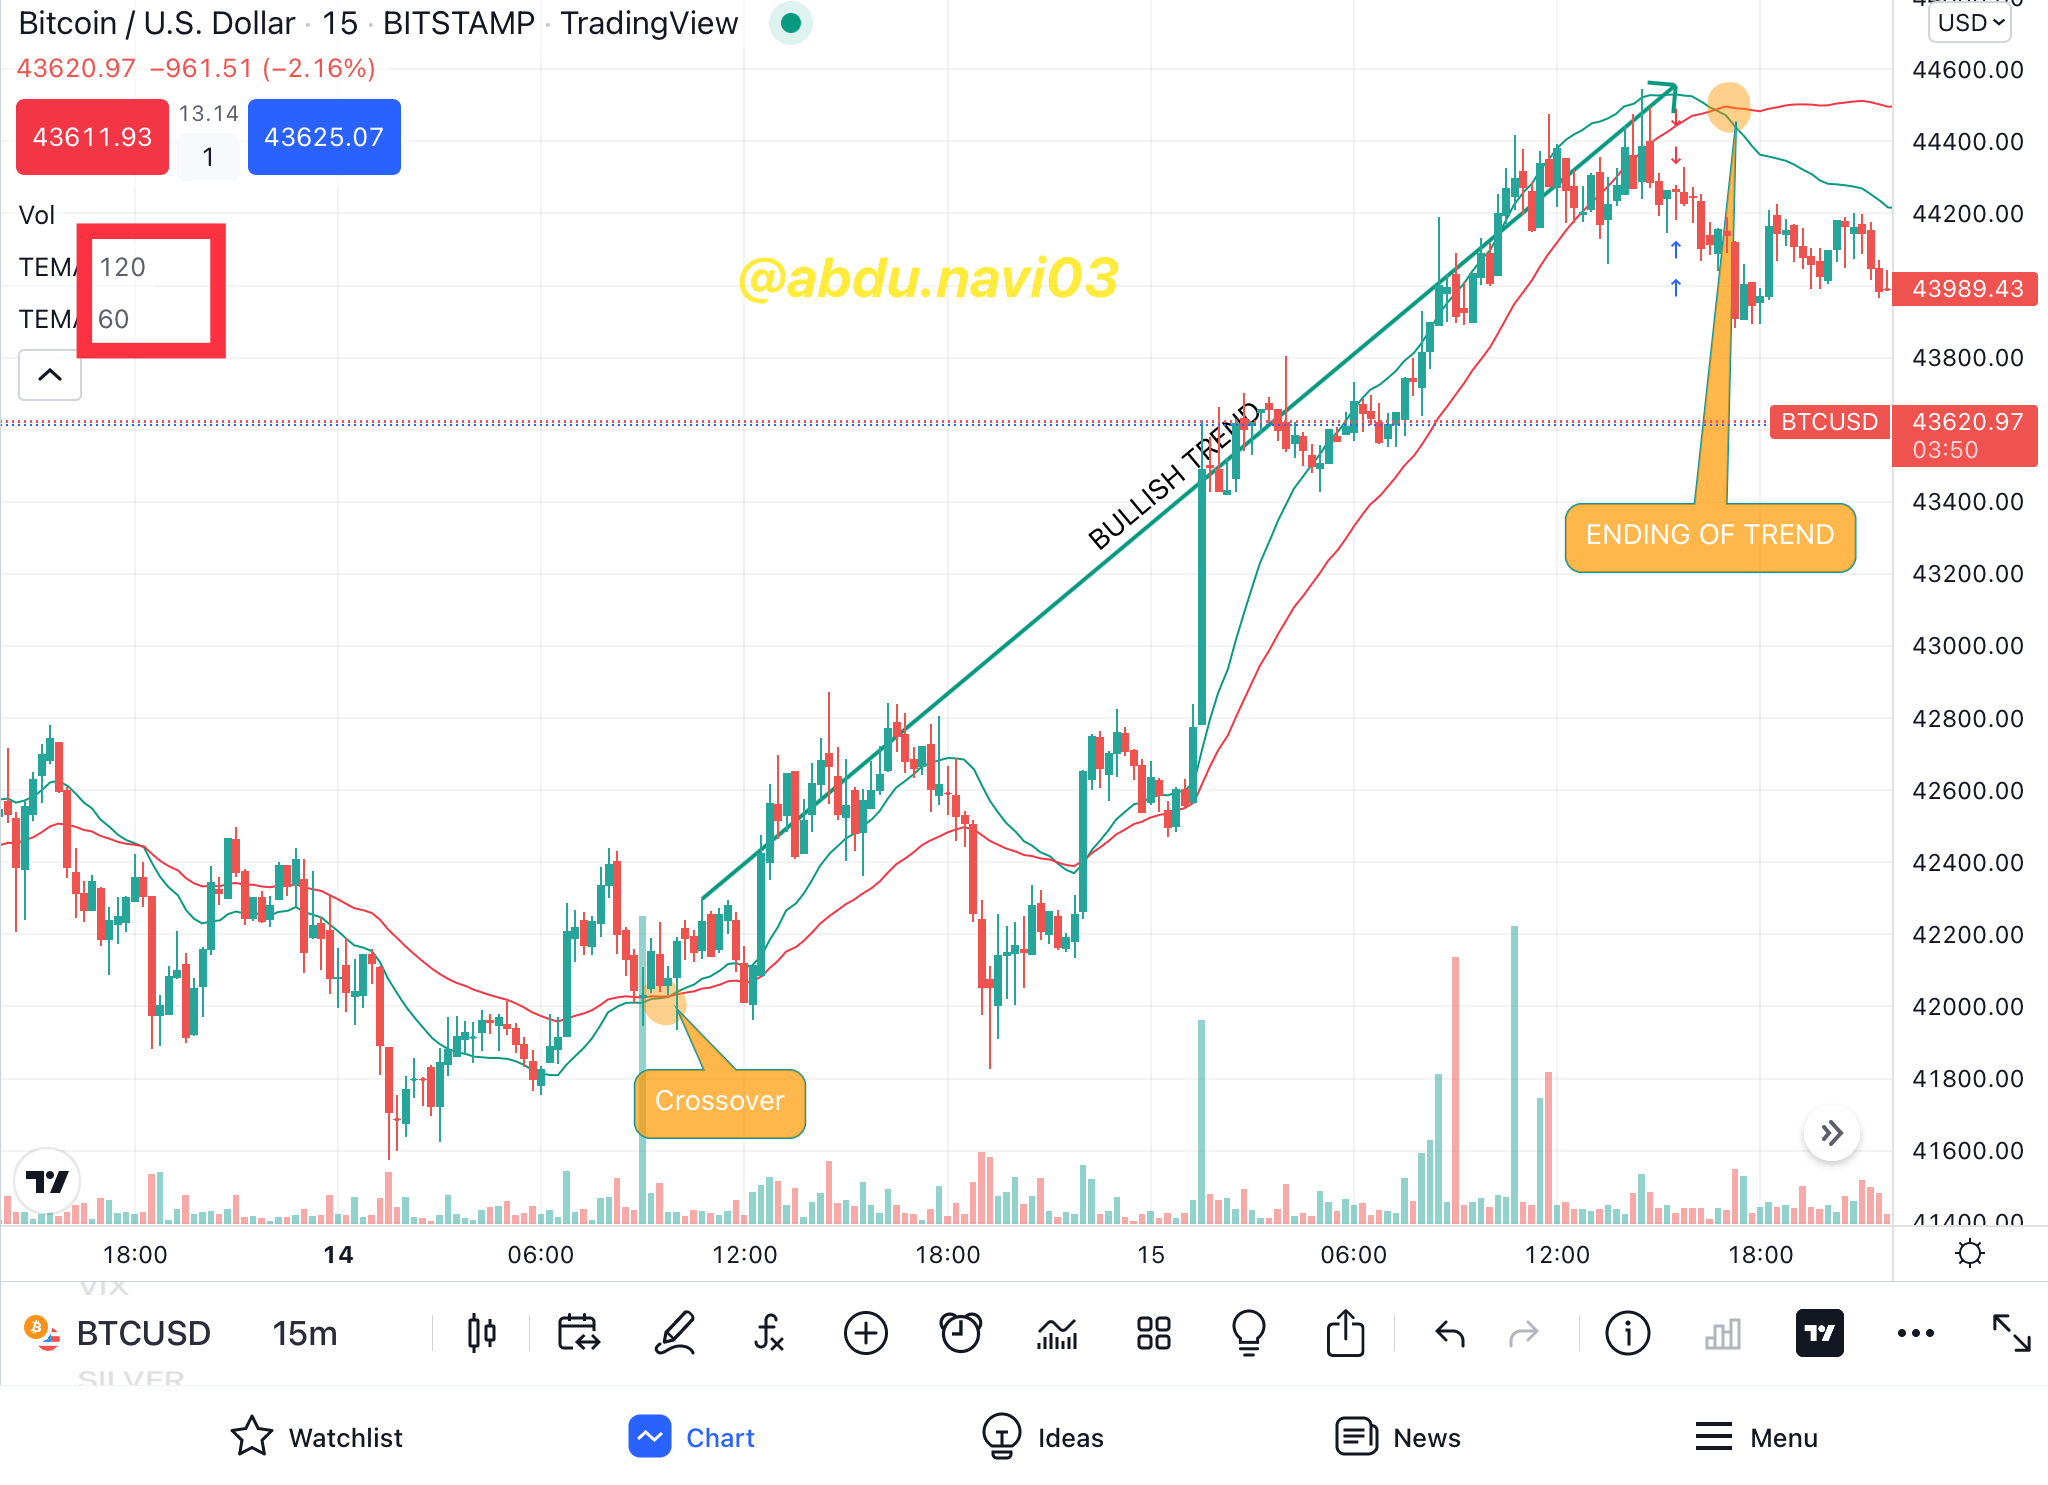
For bullish trend indication, it is necessary that the price must be below the line, before the start of trend identification. When the price crossover the TEMA line, it will be a signal for the start of a bullish trend, and it will be a trend until the price again crossovers with the TEMA line. Let me elaborate on it pictorially.
To remove the shortcomings and identify better trends I’ll be using high length on TEMA.
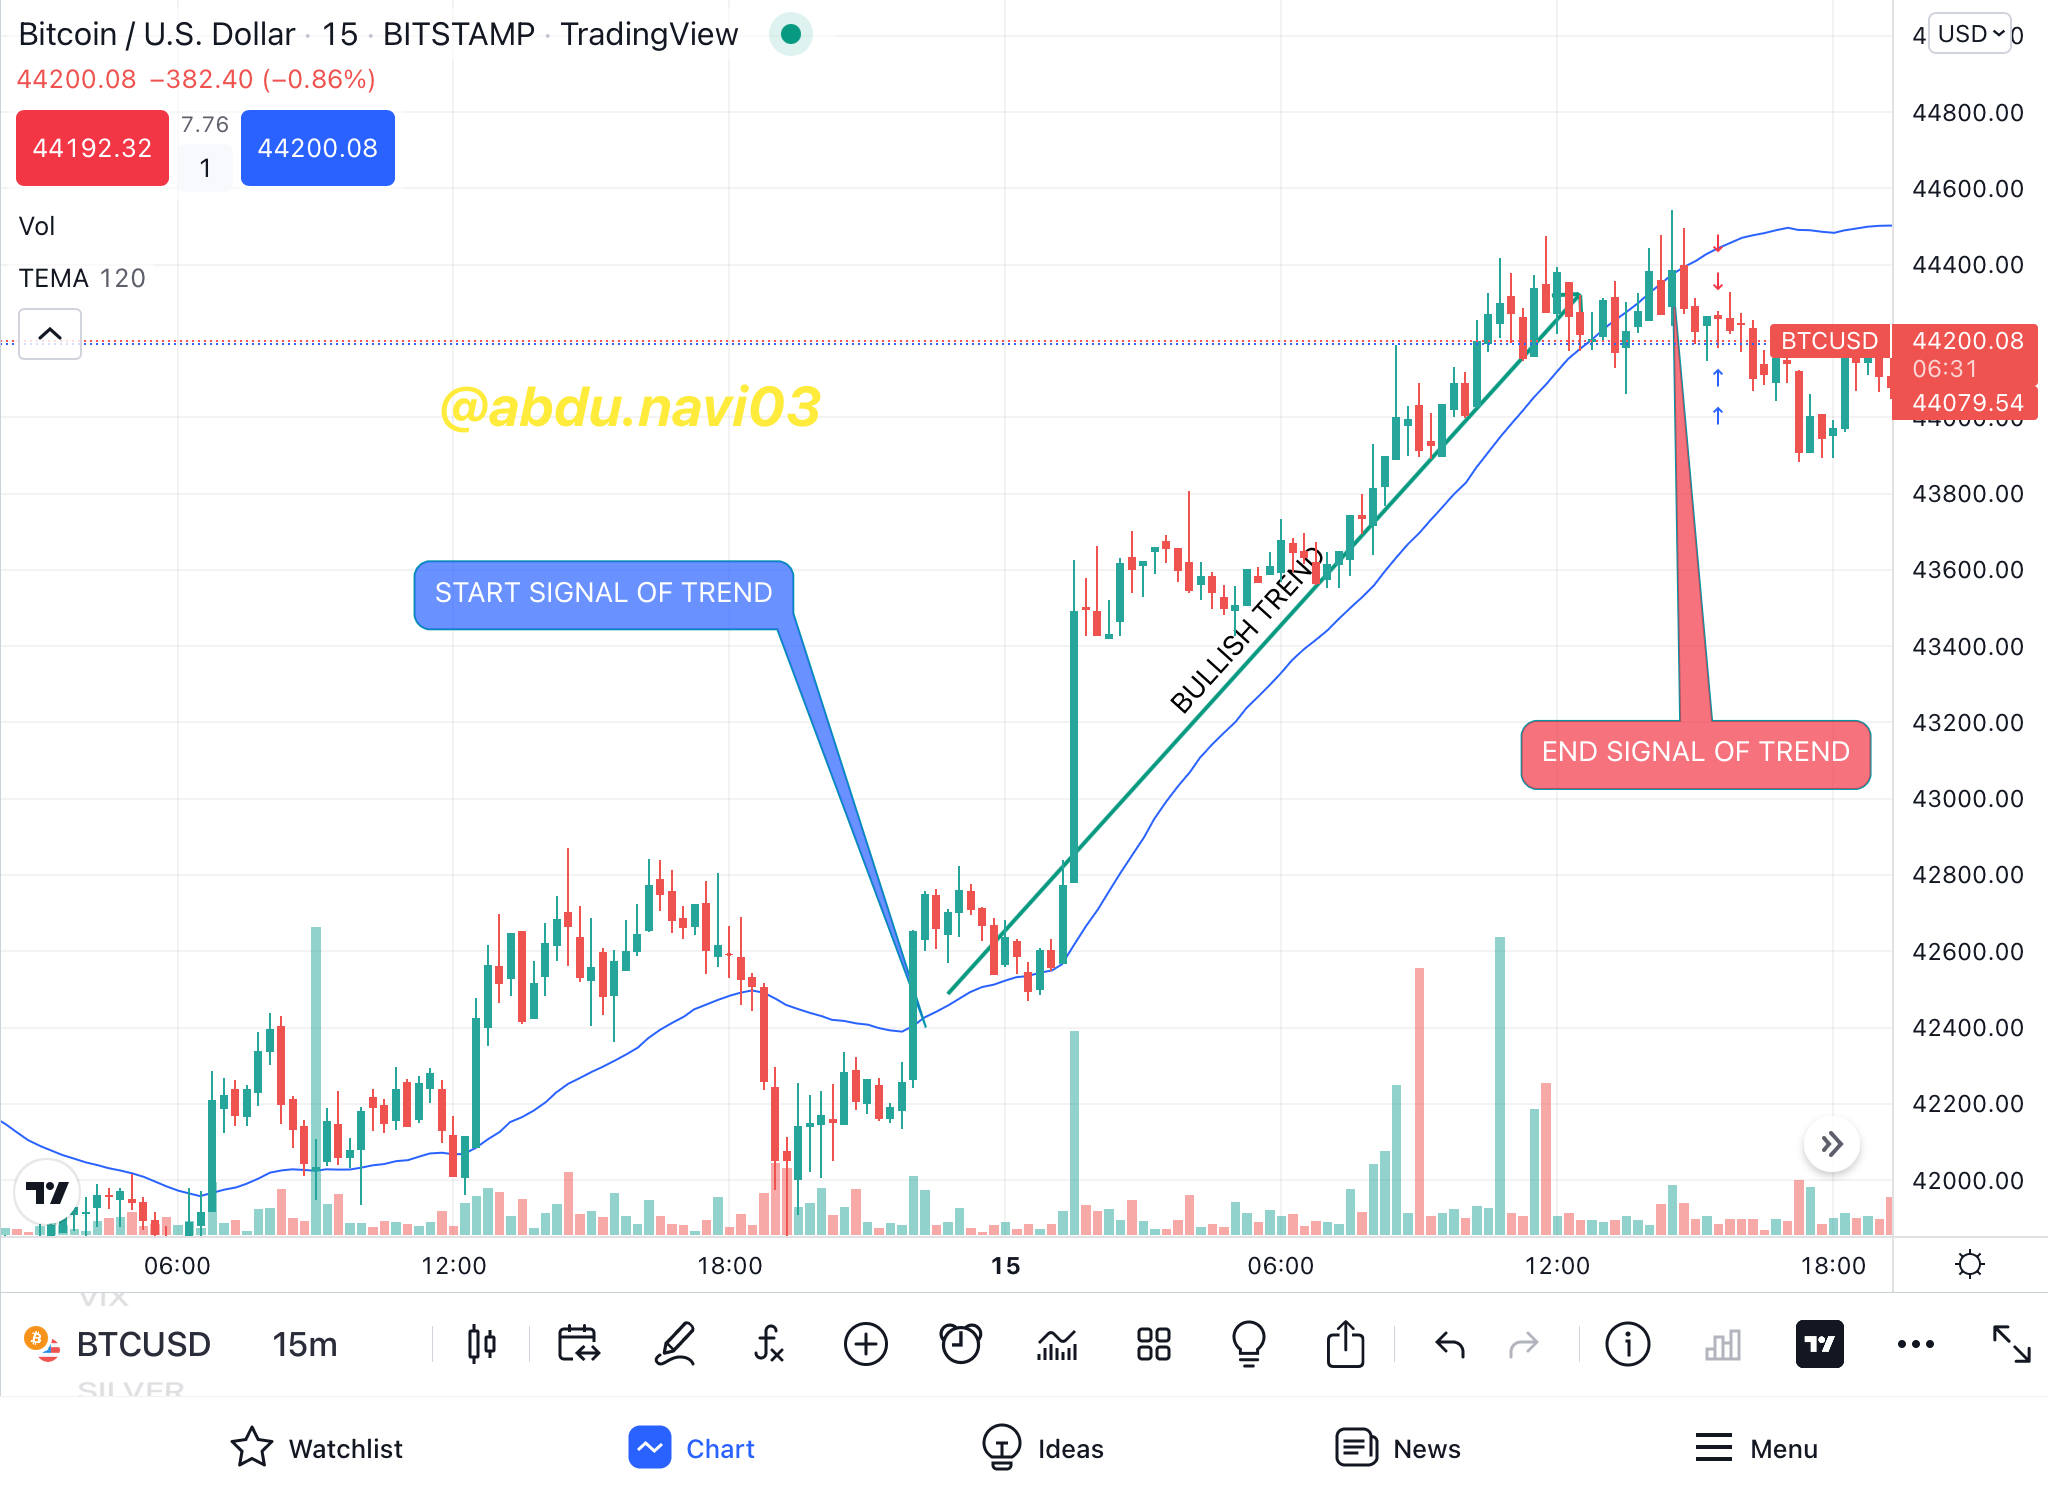
In the above screenshot of BTC/USDT pair from BitStamp exchange on tradingview application for iPad, having a time frame of 15m, we can see that, when the price crossover with the line, a bullish trend starts, and it continued until the price stay above the line. When the crossover again happened and the price come below the TEMA, it is a trend-stopping signal and indicated that the trend won’t continue more. We can see the trend reversal or the ranging phase both from this point.
BEARISH TREND
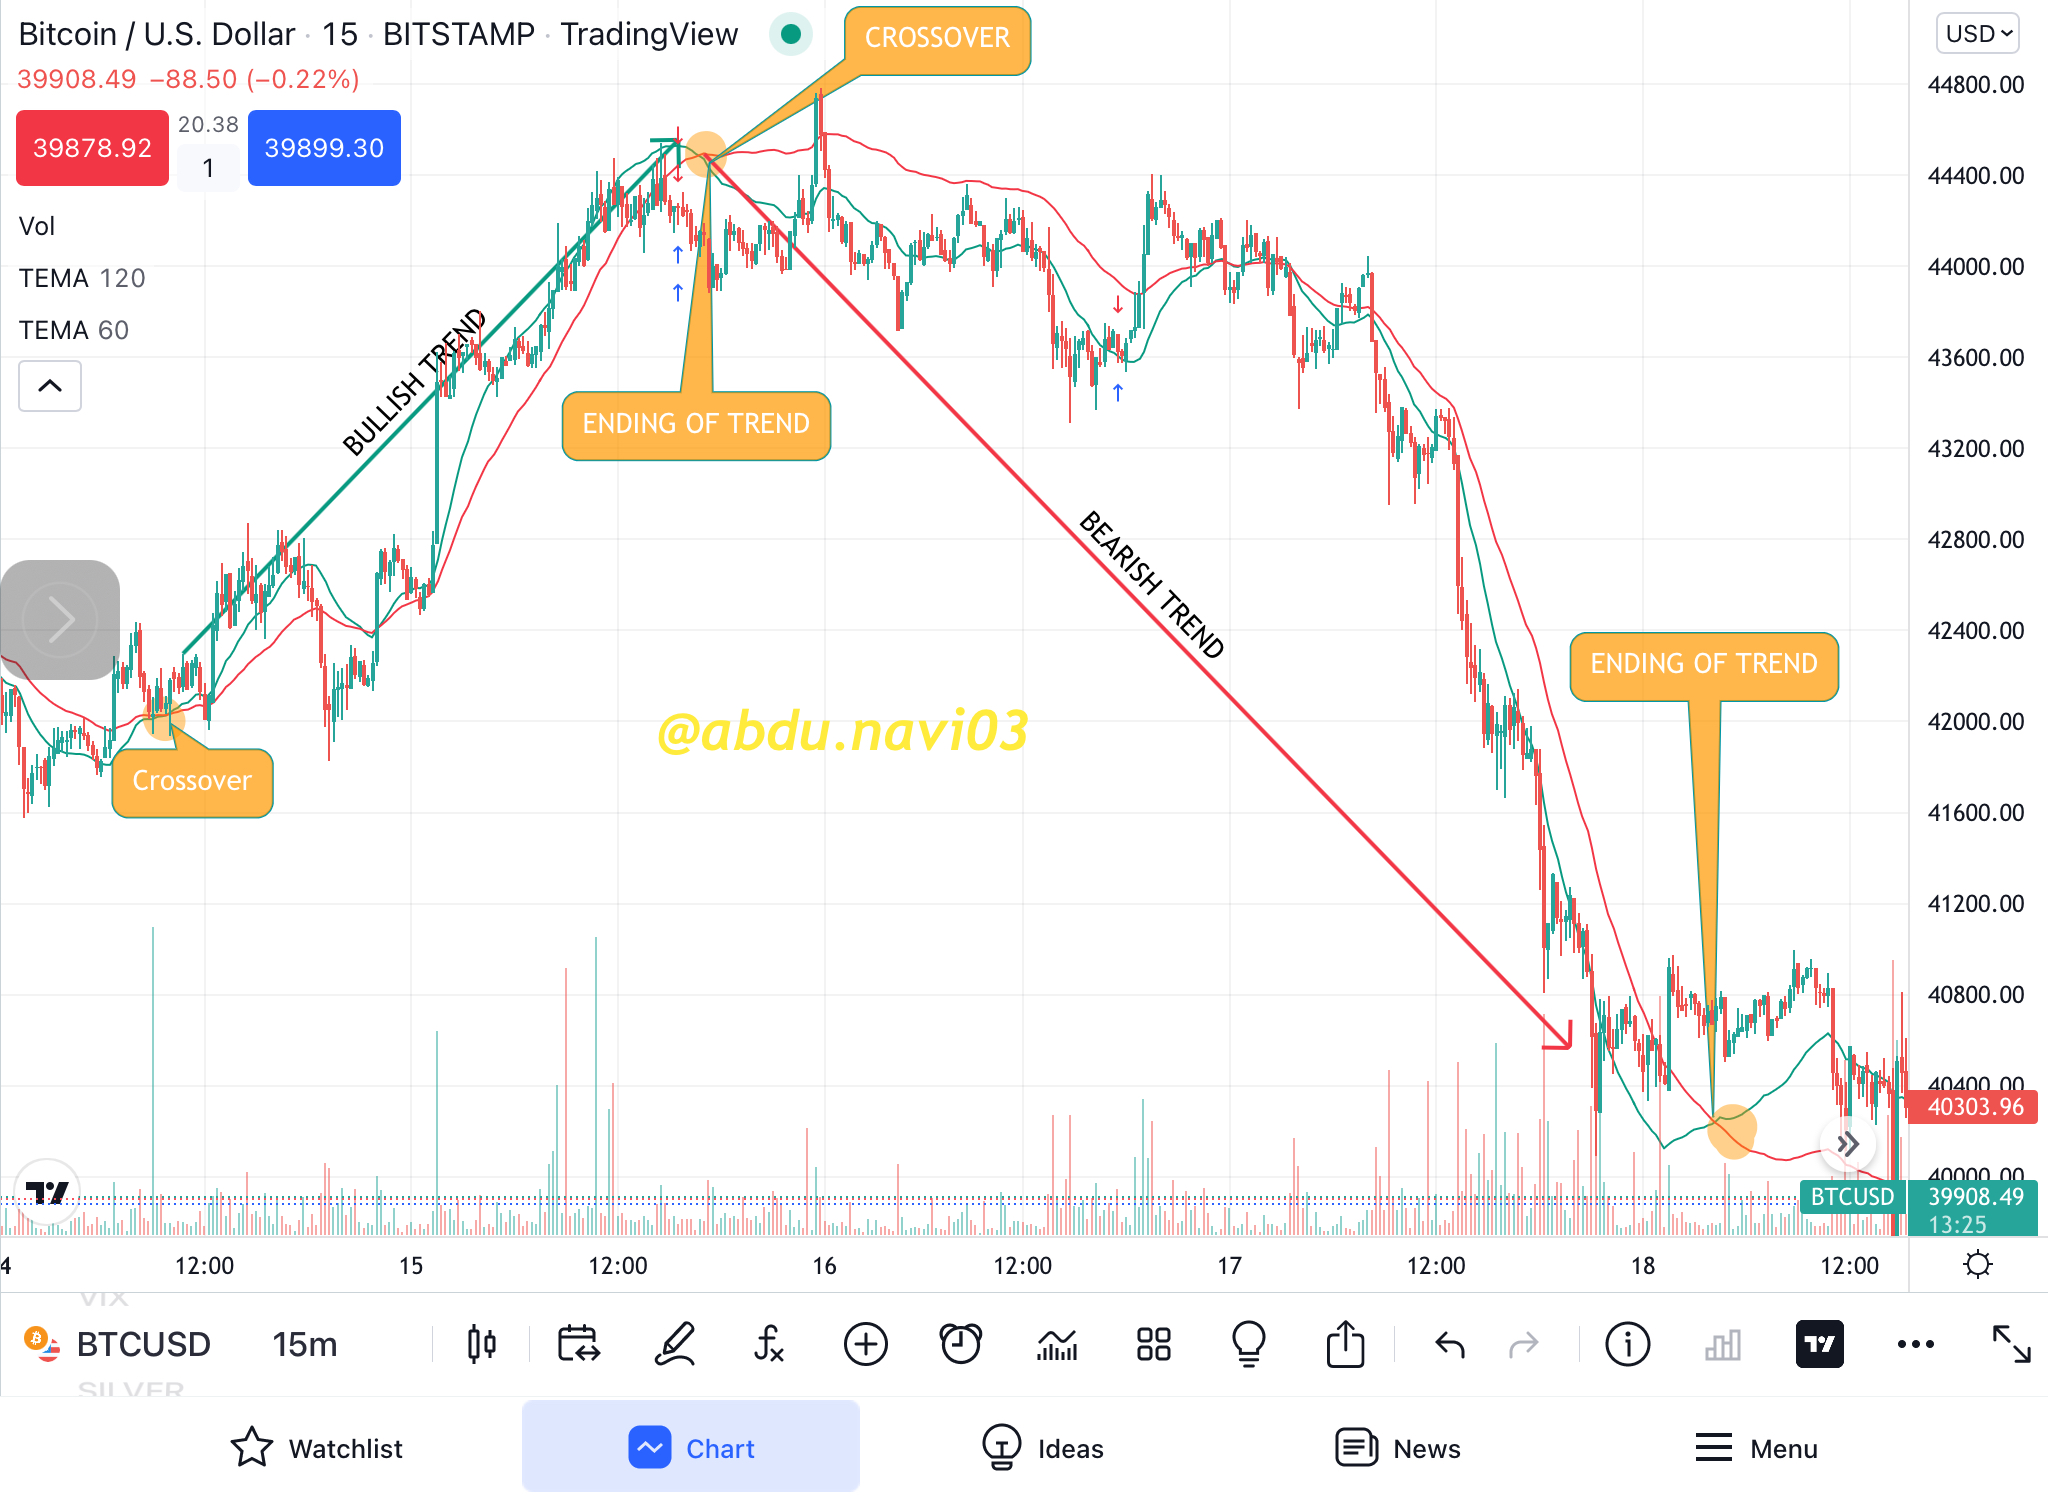
For bearish trend identification, it is necessary that the price must be above the line, before the start of trend signal or identification. When the price crossover the TEMA line, it will be a signal for the start of a bearish trend, and it will be a trend until the price again crossovers with the TEMA line. Let me elaborate on it pictorially.
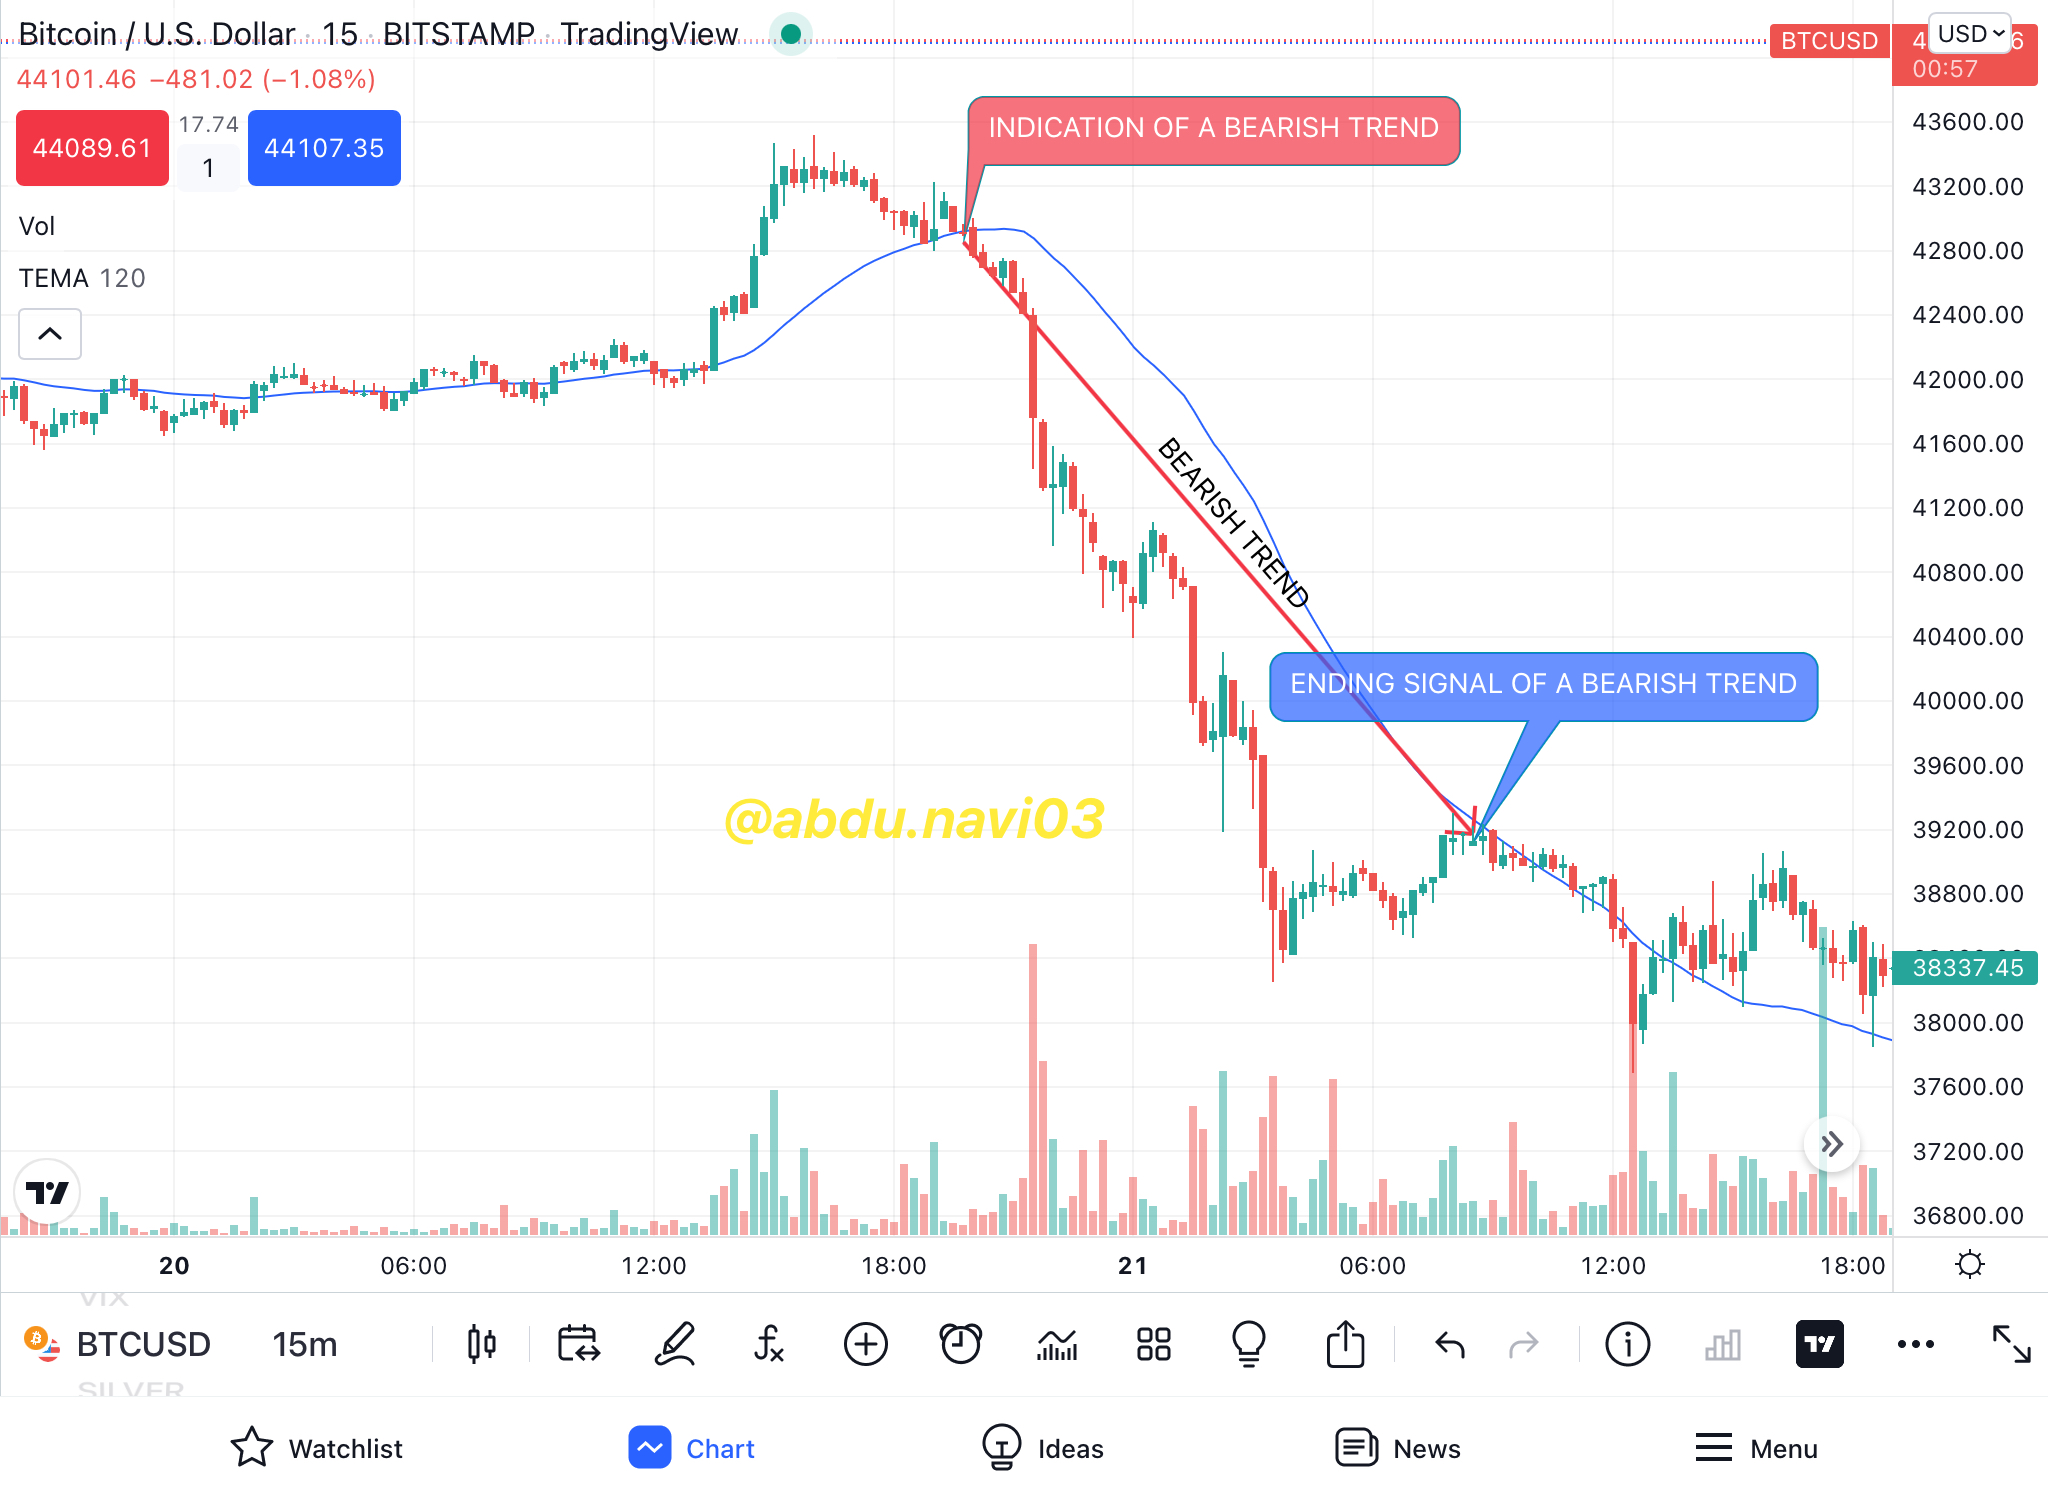
In the above screenshot of BTC/USDT pair from BitStamp exchange on tradingview application for iPad, having a time frame of 15m, we can see that when the price crossover with the line a bearish trend starts, and it continued until the price stay below the line. When the crossover again happened and the price come above the TEMA, it is a trend stopping the signal and indicates that the trend won't be continuing more. We can see the trend reversal or the ranging phase both from this point.
SUPPORT AND RESISTANCE
For any trader, the two most important price levels are support and resistance. And mostly, therefore, traders' likeness will be more with that indicator in which price acts in more percentage.
SUPPORT
In a bullish trend explained just above, when the price overcomes the TEMA line, the TEMA line acts as dynamic support for the price.
For those who don’t know, dynamic support is the support that changes alongside the changing of price.
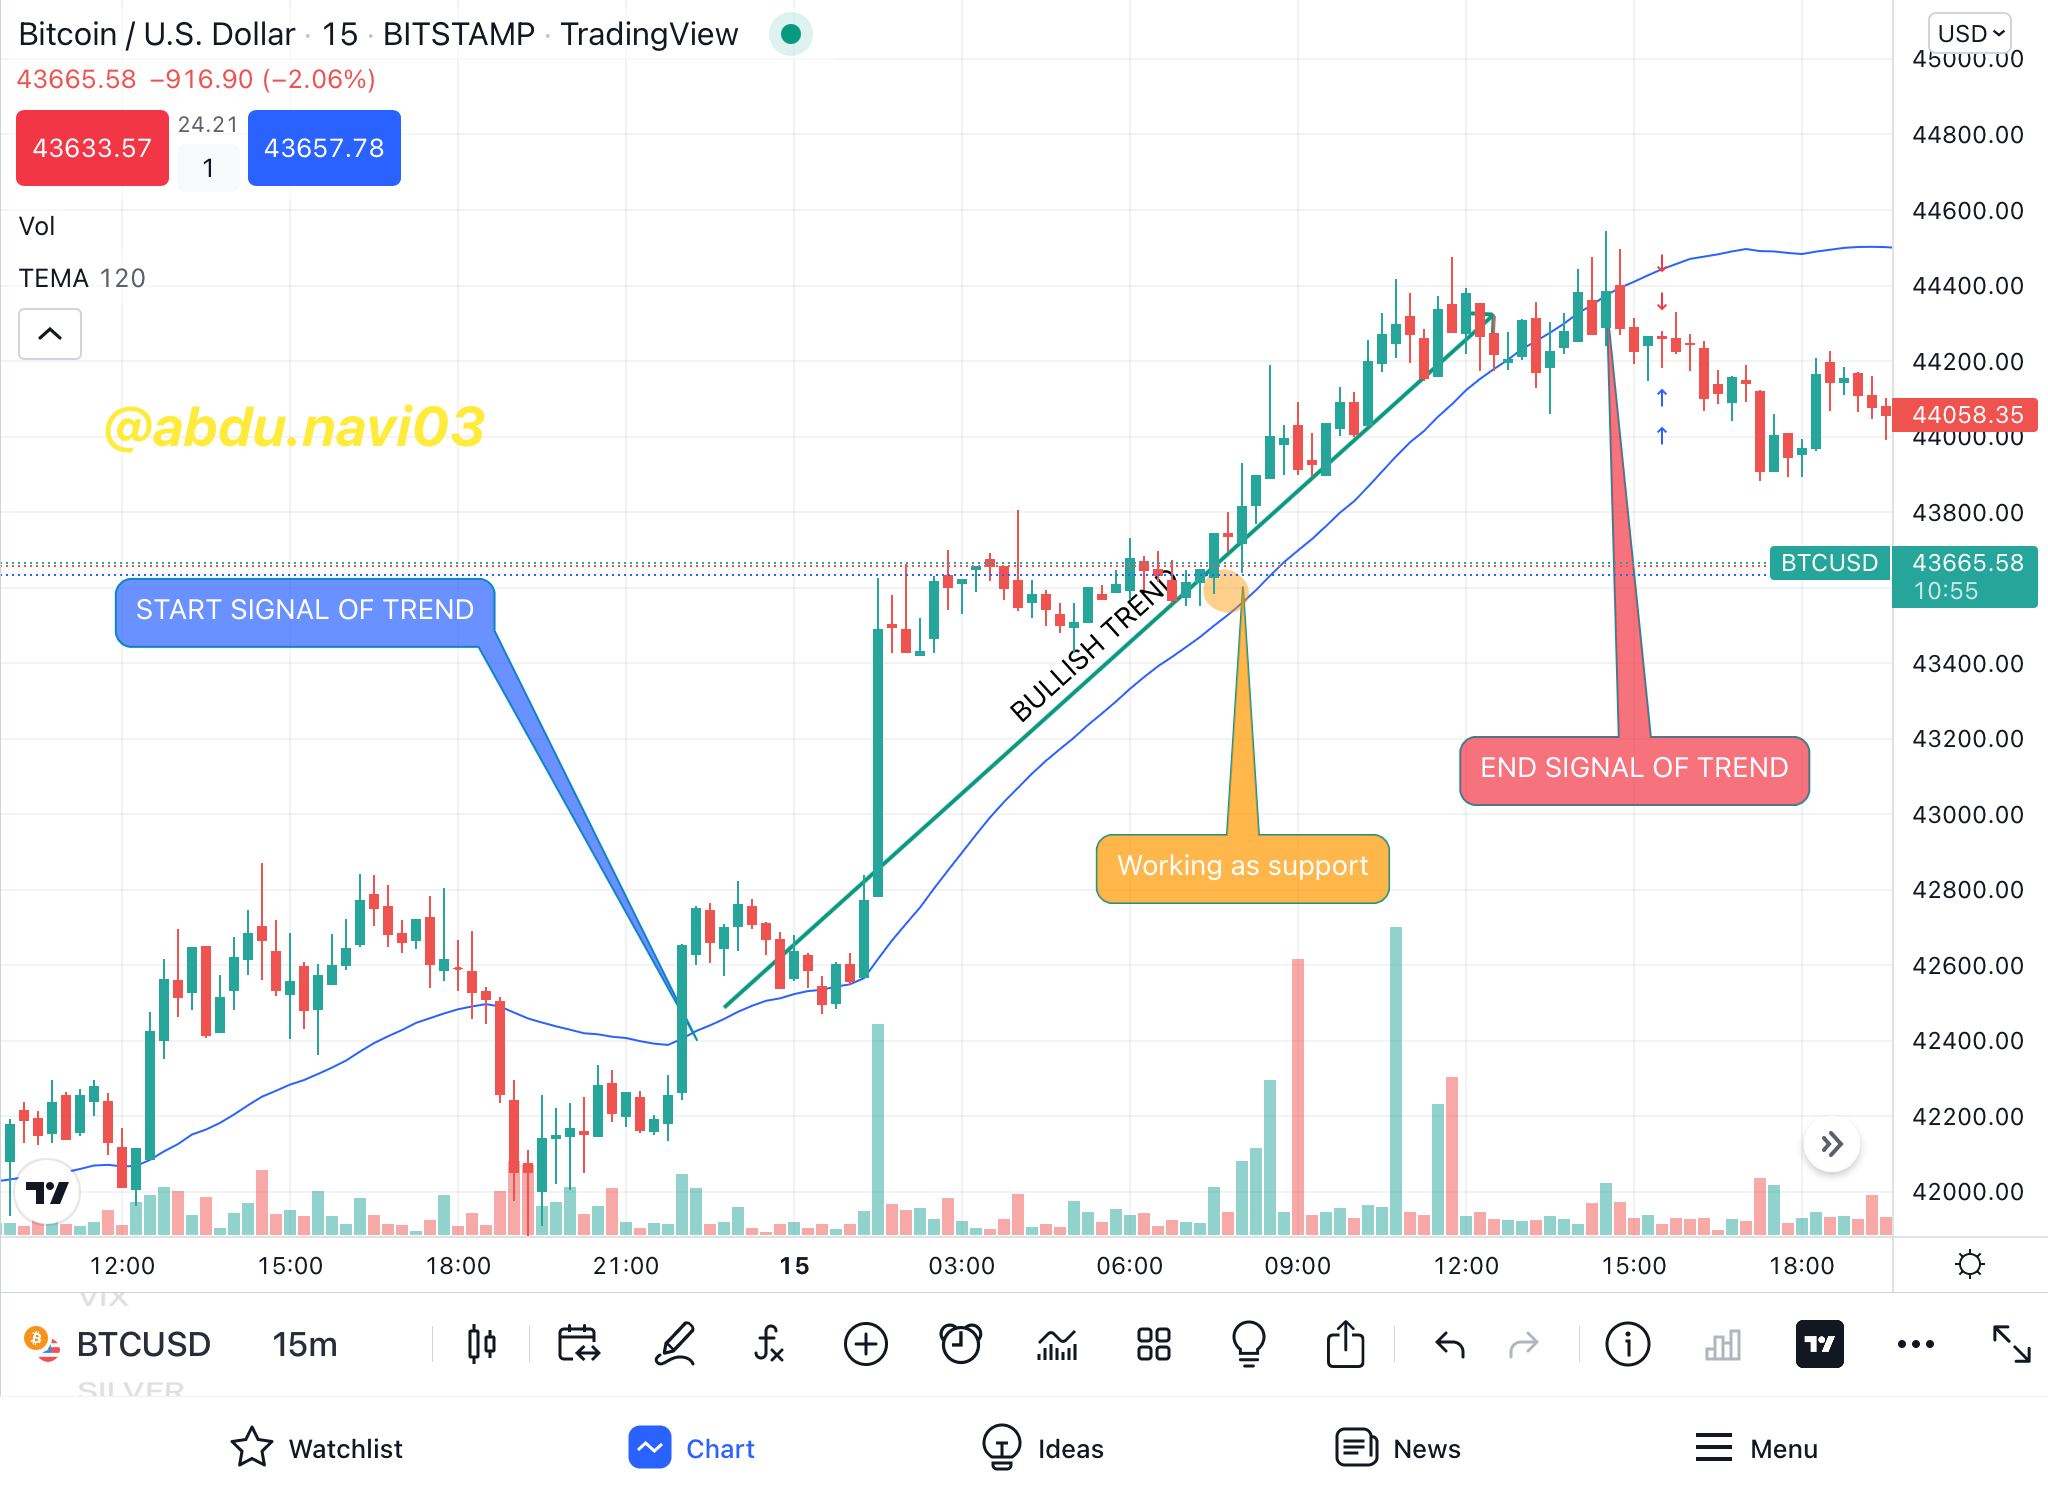
In this screenshot of BTC/USDT from BitStamp, having a time frame of 15m, we can see that the TEMA line act as support throughout the bullish trend. The plus point of this dynamic support is the more the difference between the price and the support the more the support is strong.
RESISTANCE
In a bearish trend that I explained just above, when the price overcomes the TEMA line, the TEMA line acts as dynamic resistance for the price.
For those who don’t know, dynamic resistance is a resistance that changes alongside the change of price.
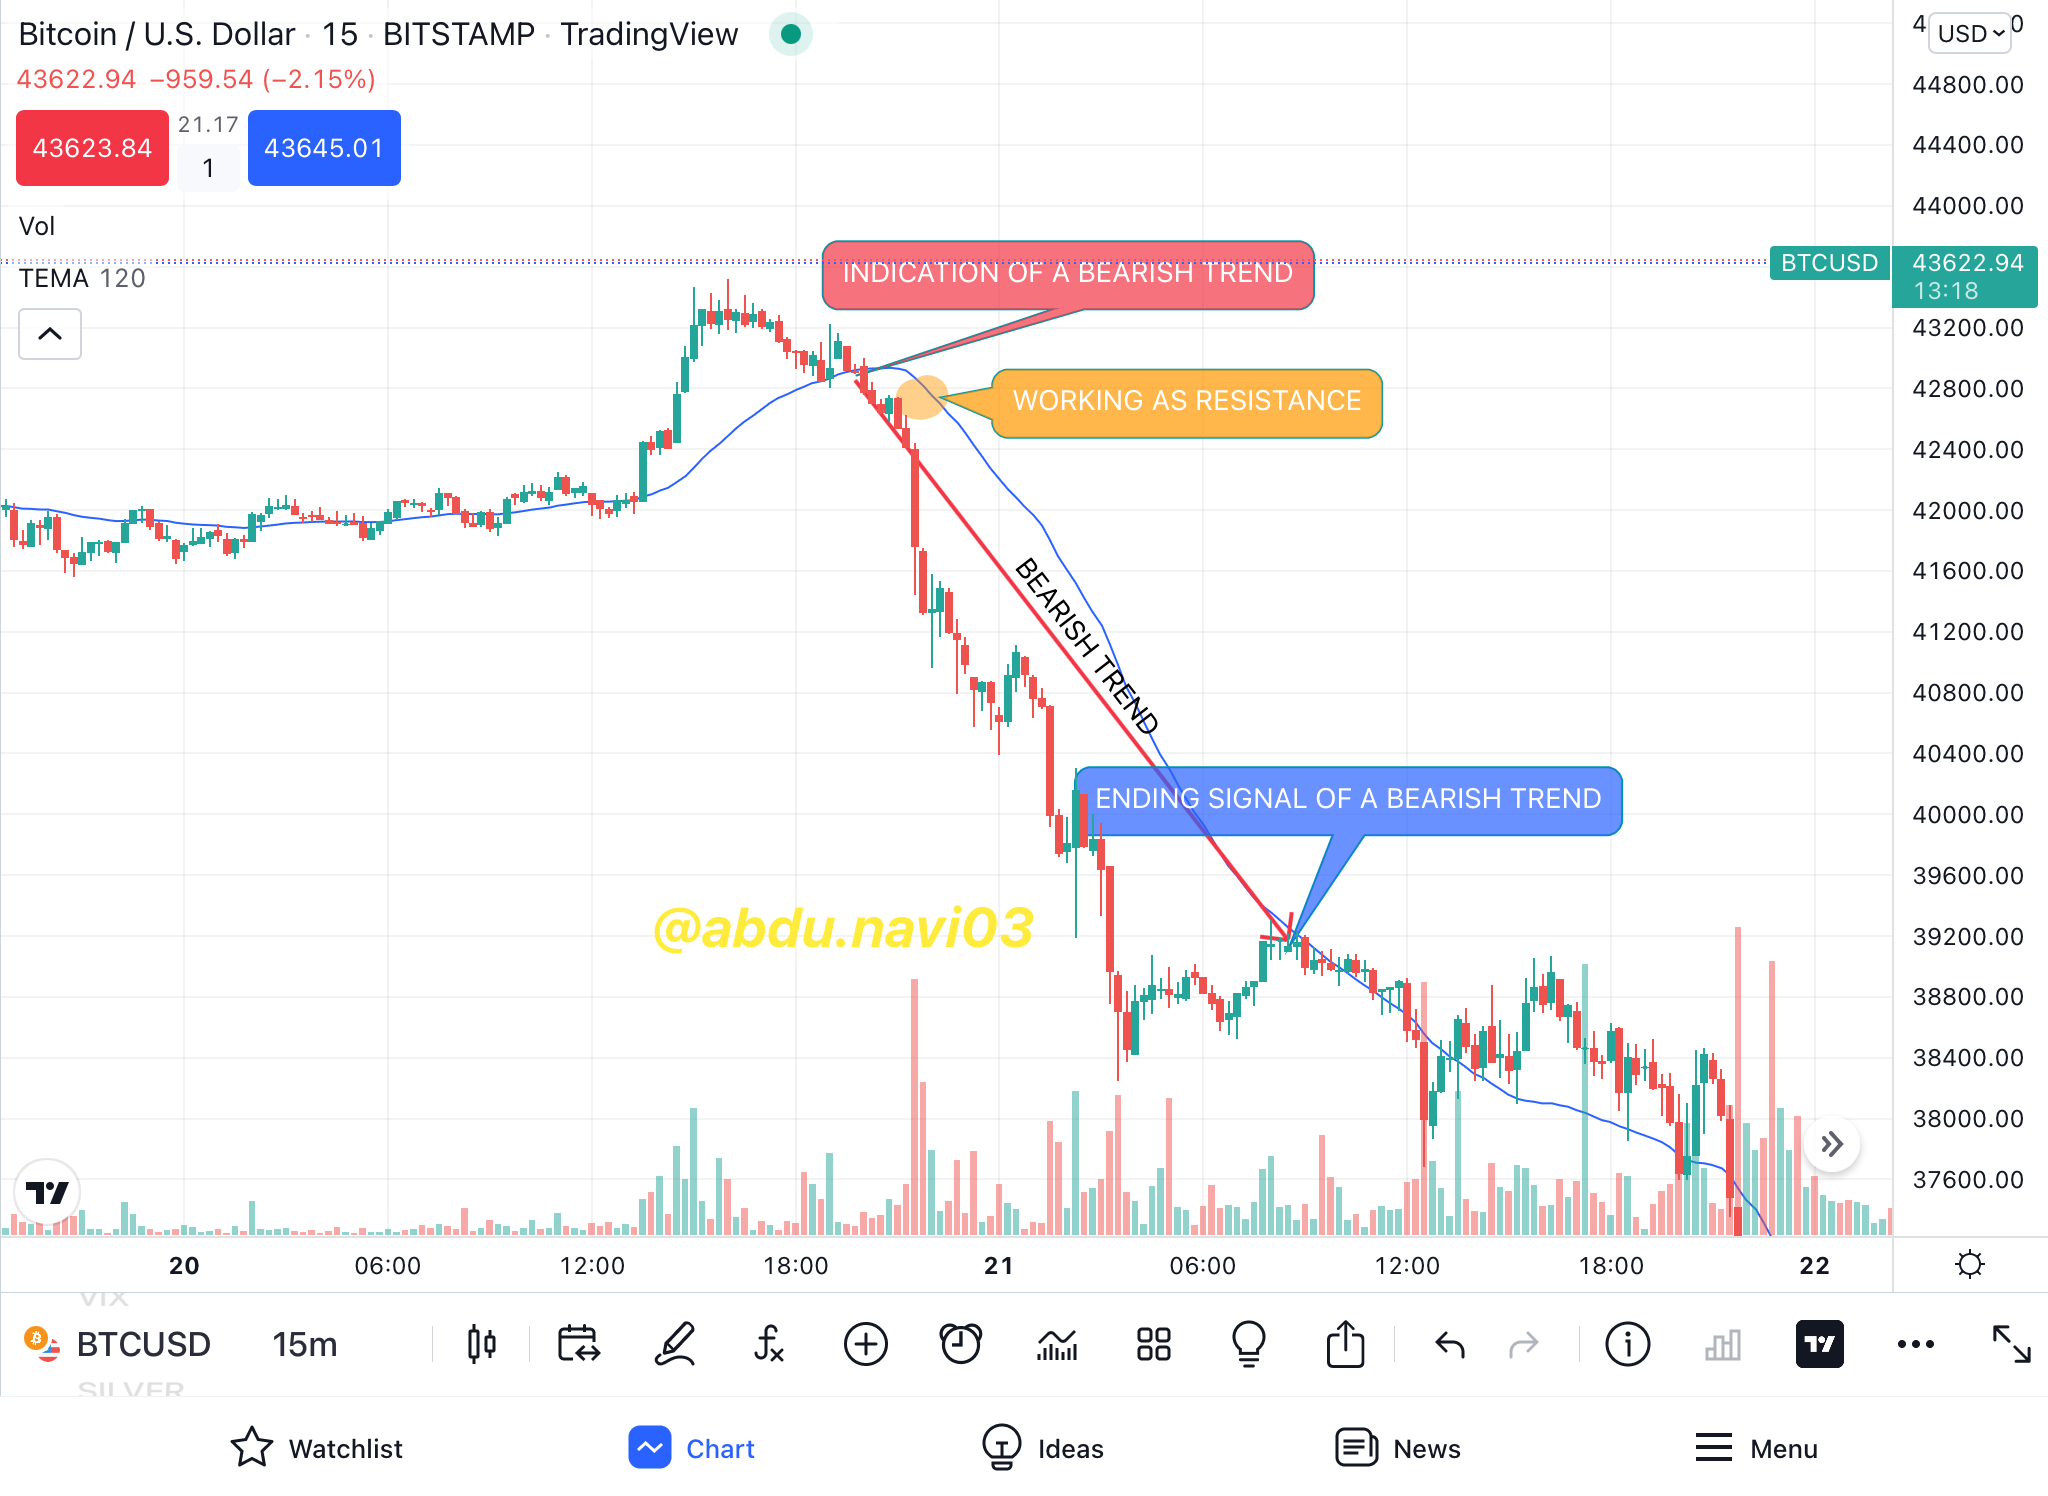
In this screenshot of BTC/USDT from BitStamp exchange, having a time frame of 15m, we can see that the TEMA line act as resistance throughout the bearish trend. The plus point of this dynamic resistance is the more the difference between the price and the resistance the more the resistance is strong.
Any indicator when worked alone is a danger itself. Because every indicator there is up until now, show something, at the expense of something. Or sometimes by changing the settings you can get desired results at the expense of some information. Therefore combining two or more indicators is a very good and always recommended thing.
COMBINATION OF TWO TEMA
TEMA, as I said just like any other indicator is a trend tracker indicator. Therefore just like by changing the length of normal EMAs or MAs the trend, the lines and signals can be fast, therefore it happens in TEMA’s case too, but just better. Because TEMA is already a fast indicator. Moreover, it produces both types of signals, and signals generated on the crossover of both.
BULLISH SIGNAL
The bullish signal by the usage of two TEMA indicators together can be generated whenever the fast TEMA, the one with the low length surpass the Slow TEMA indicator, the one with the more length numerically. For it to be bullish, please note in mind that the fast TEMA should be upper than Slow TEMA, it tells that the buyers in short previous history are coming into the market and pushes the price, while stabling of slow TEMA, at that time indicates that buyers, the one which has more volume aren’t exiting from the market.
In this screenshot of BTC/USDT, having a time frame of 15m from BitStamp exchange on trading view, we can see that I’ve boxed my desired lengths, I’ve chosen 60 for the fast one and 120 for the slow one. Moreover, I have changed the color in this way that the fast one is green and the slow one is red. So. It will be simple if the green is above, it's a bullish signal. One thing that you might notice, it's almost the same chart screenshot that I used above for explaining the signal from TEMA. But that signal was indicated late by only using one TEMA. Therefore using two TEMA is not only better but recommended.
BEARISH SIGNAL
The bearish signal is by the two TEMA indicators together can be generated whenever the fast TEMA, the one with the low length surpass the slow TEMA indicator, the one with the more length numerically. For it to be bearish, please note in mind that the fast TEMA should be lower than Slow TEMA. It tells that the sellers in short previous history are selling their assets and leaving the market. While stabling of Sow TEMA, at that time indicates that, the sellers which have more volume are exiting the market and new buyers are not much rapid.
In this screenshot of BTC/USDT, having a time frame of 15m from BitStamp on tradingview, we can observe that I kept the lengths, just as they were in the above screenshot. And I’ve kept the same colors too. In this screenshot you might notice that after that bullish signal I’ve shown, the crossover happened and the bullish trend stops. In this screenshot, from that point, the bearish signal started and the price started to fall down.
As TEMA is a trend-based and trend-catching indicator. Therefore its entry and exit points are just as trend-based.
Buy signal is when the trend starts, and identifying the trend using two TEMA indicators is best. And to manage risk and reward, the stop loss will be the breaking of trend, meanwhile, the take profit would be when the crossover happens after the profit.
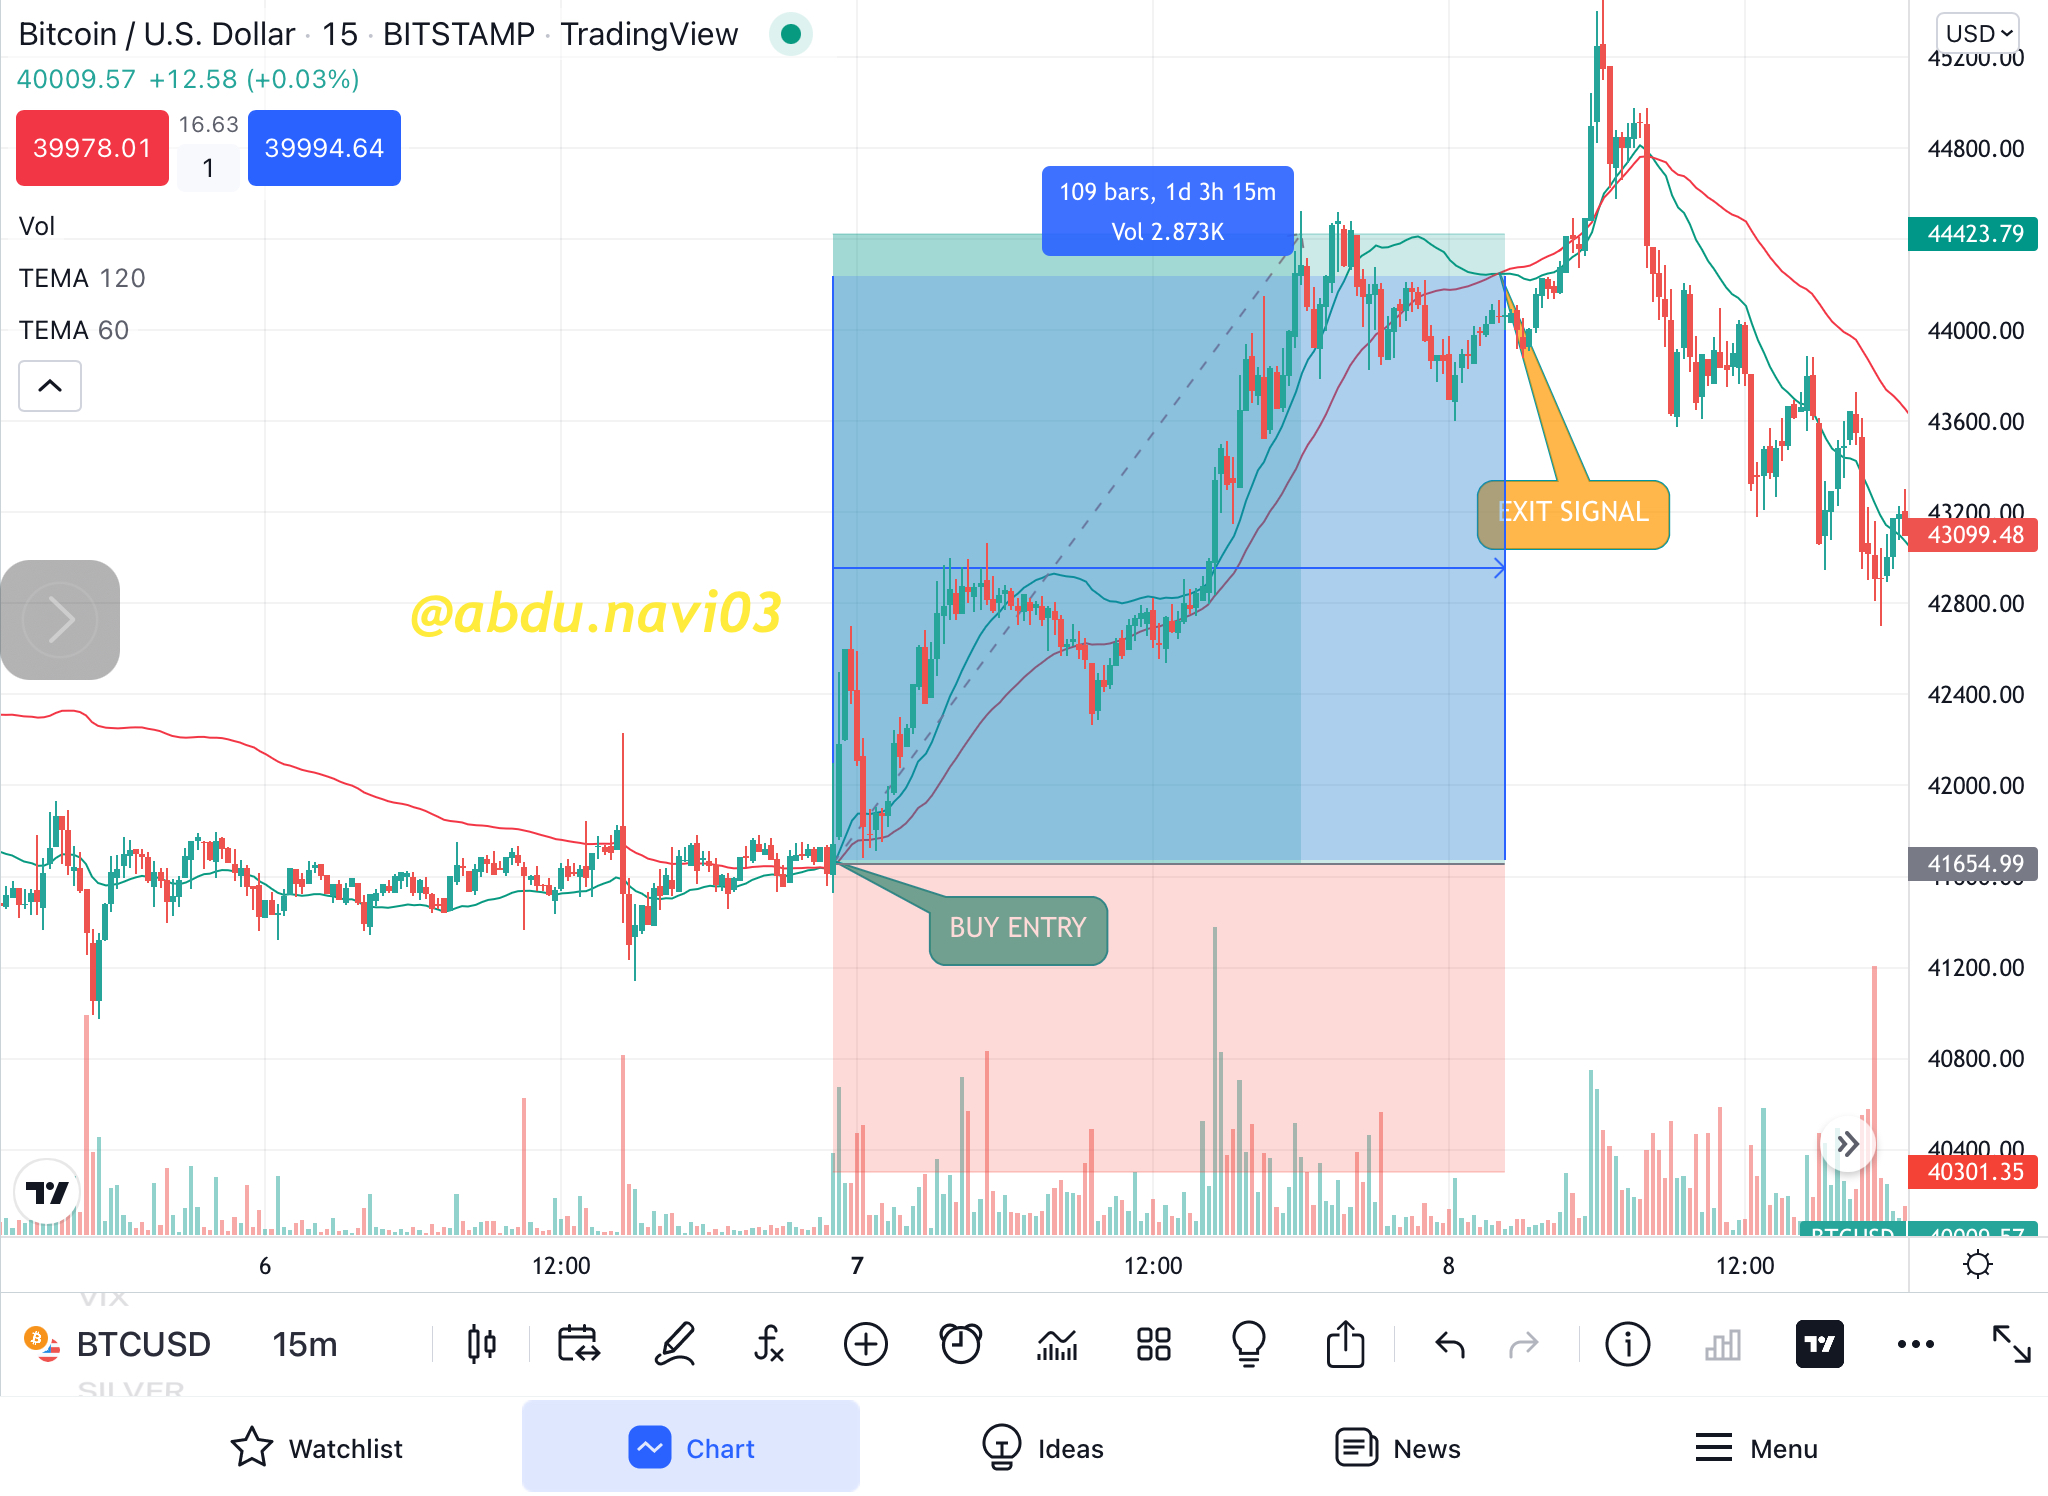
In this screenshot of BTC/USDT from BitStamp on Tradingview application, we can see that a buy signal is generated by the combination of two TEMAs. The stop loss you can see, though it is set that below but for this strategy, the stop loss will be applied when the price moves down then these two indicators.
Sell signal is when the downtrend starts, and identifying the trend using two TEMA indicators is best. I’ll manage the risk in the same way.
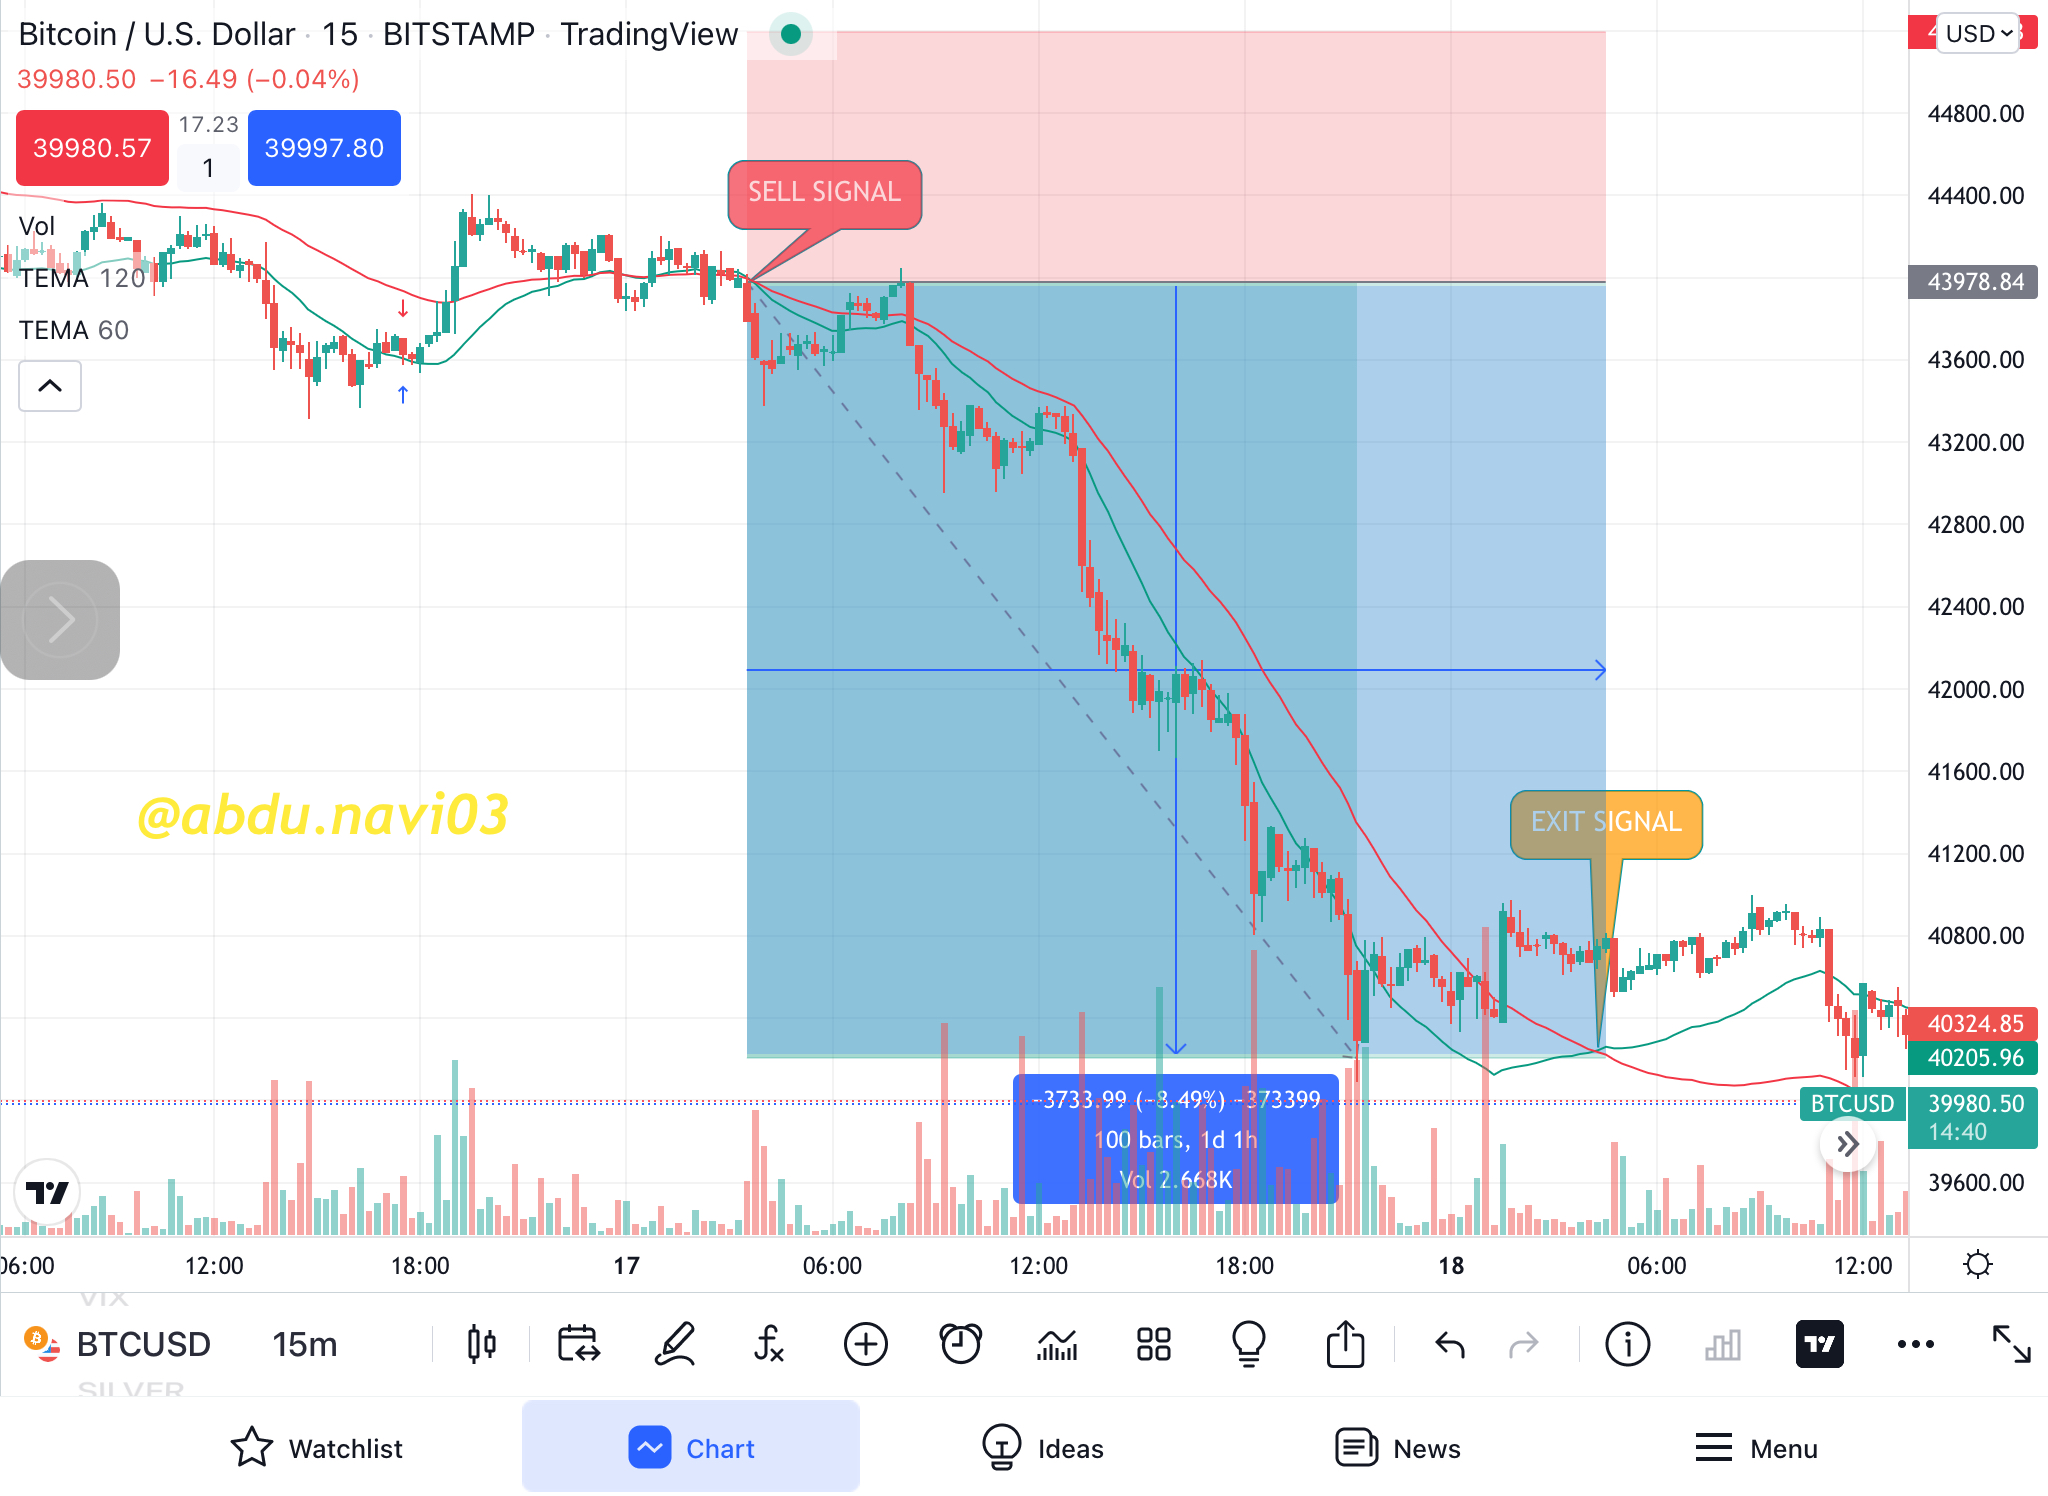
In this screenshot of BTC/USDT from BitStamp on tradingview application, we can see that a sell signal is generated by the combination of two TEMAs. The stop loss as you can see, though it is set below for this strategy, stop loss will be applied when the price moved up than these two indicators.
The indicator I would use with any moving average, for trend identification, would be RSI. As RSI tells us, either the buyers are in control or sellers, or even if the market is in trend or not.
DEMO TRADE
In this screenshot, it is clear that when TEMA surpasses, I wasn’t watching the chart but as soon as I saw it, I see that as an opportunity, to open a trade, as the trend was just starting. Its confirmation will be with RSI’s double top.
REAL TRADE
I will do real trade on the Margex platform.
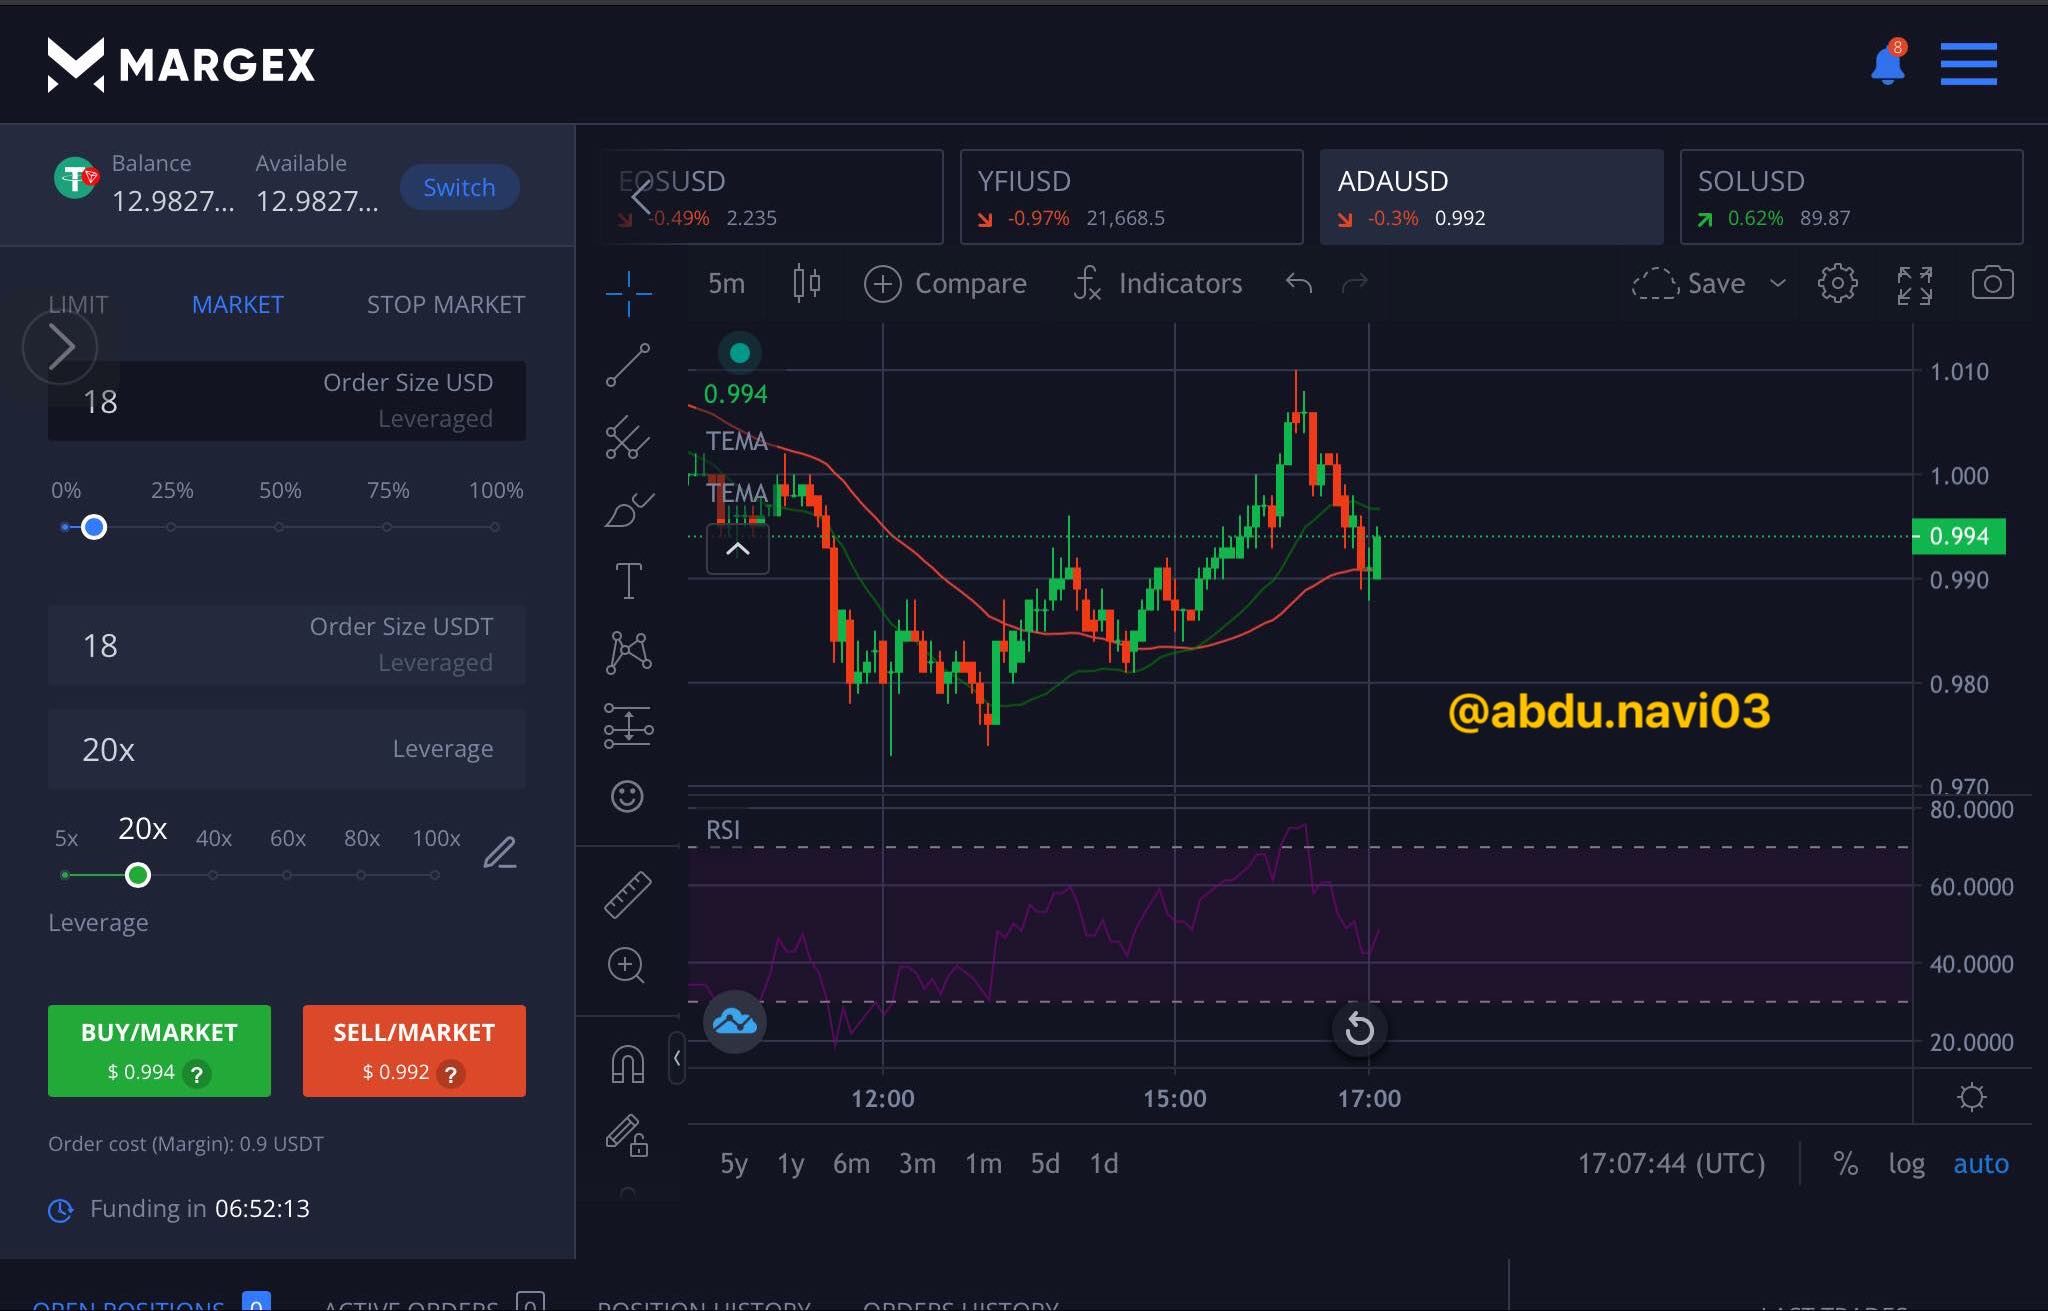
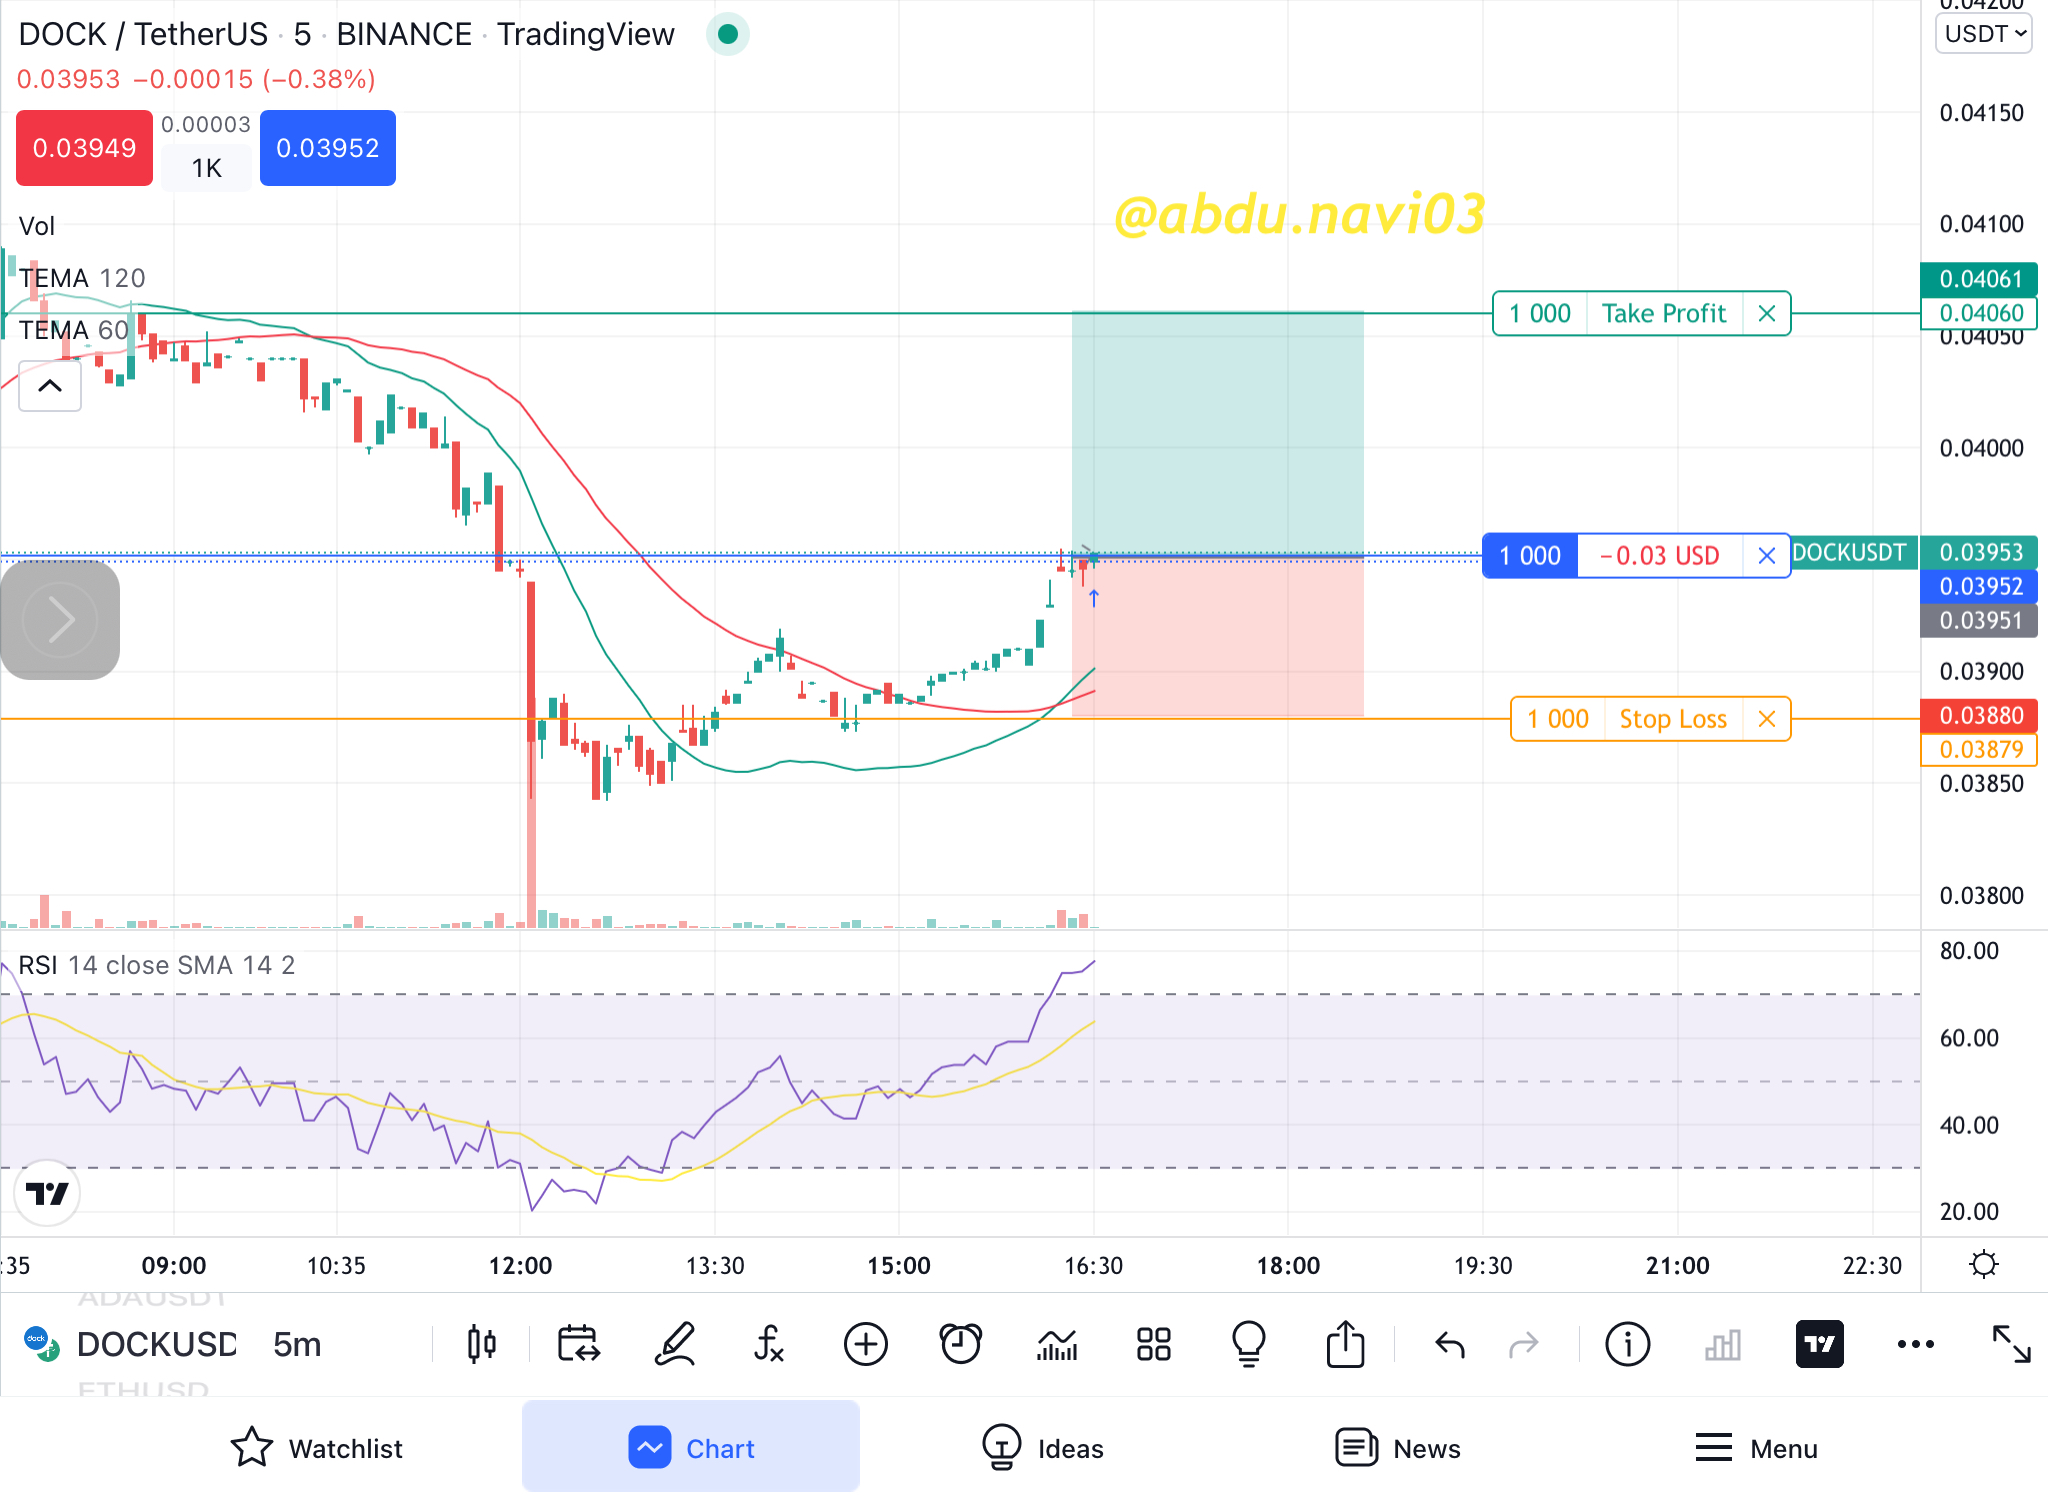
As you can see in this screenshot from Binance, the price from TEMA of a slow one, bounces back and RSI is below 50, that's a good scalp trading point, therefore I put the trade of $18, taking 20% leverage.
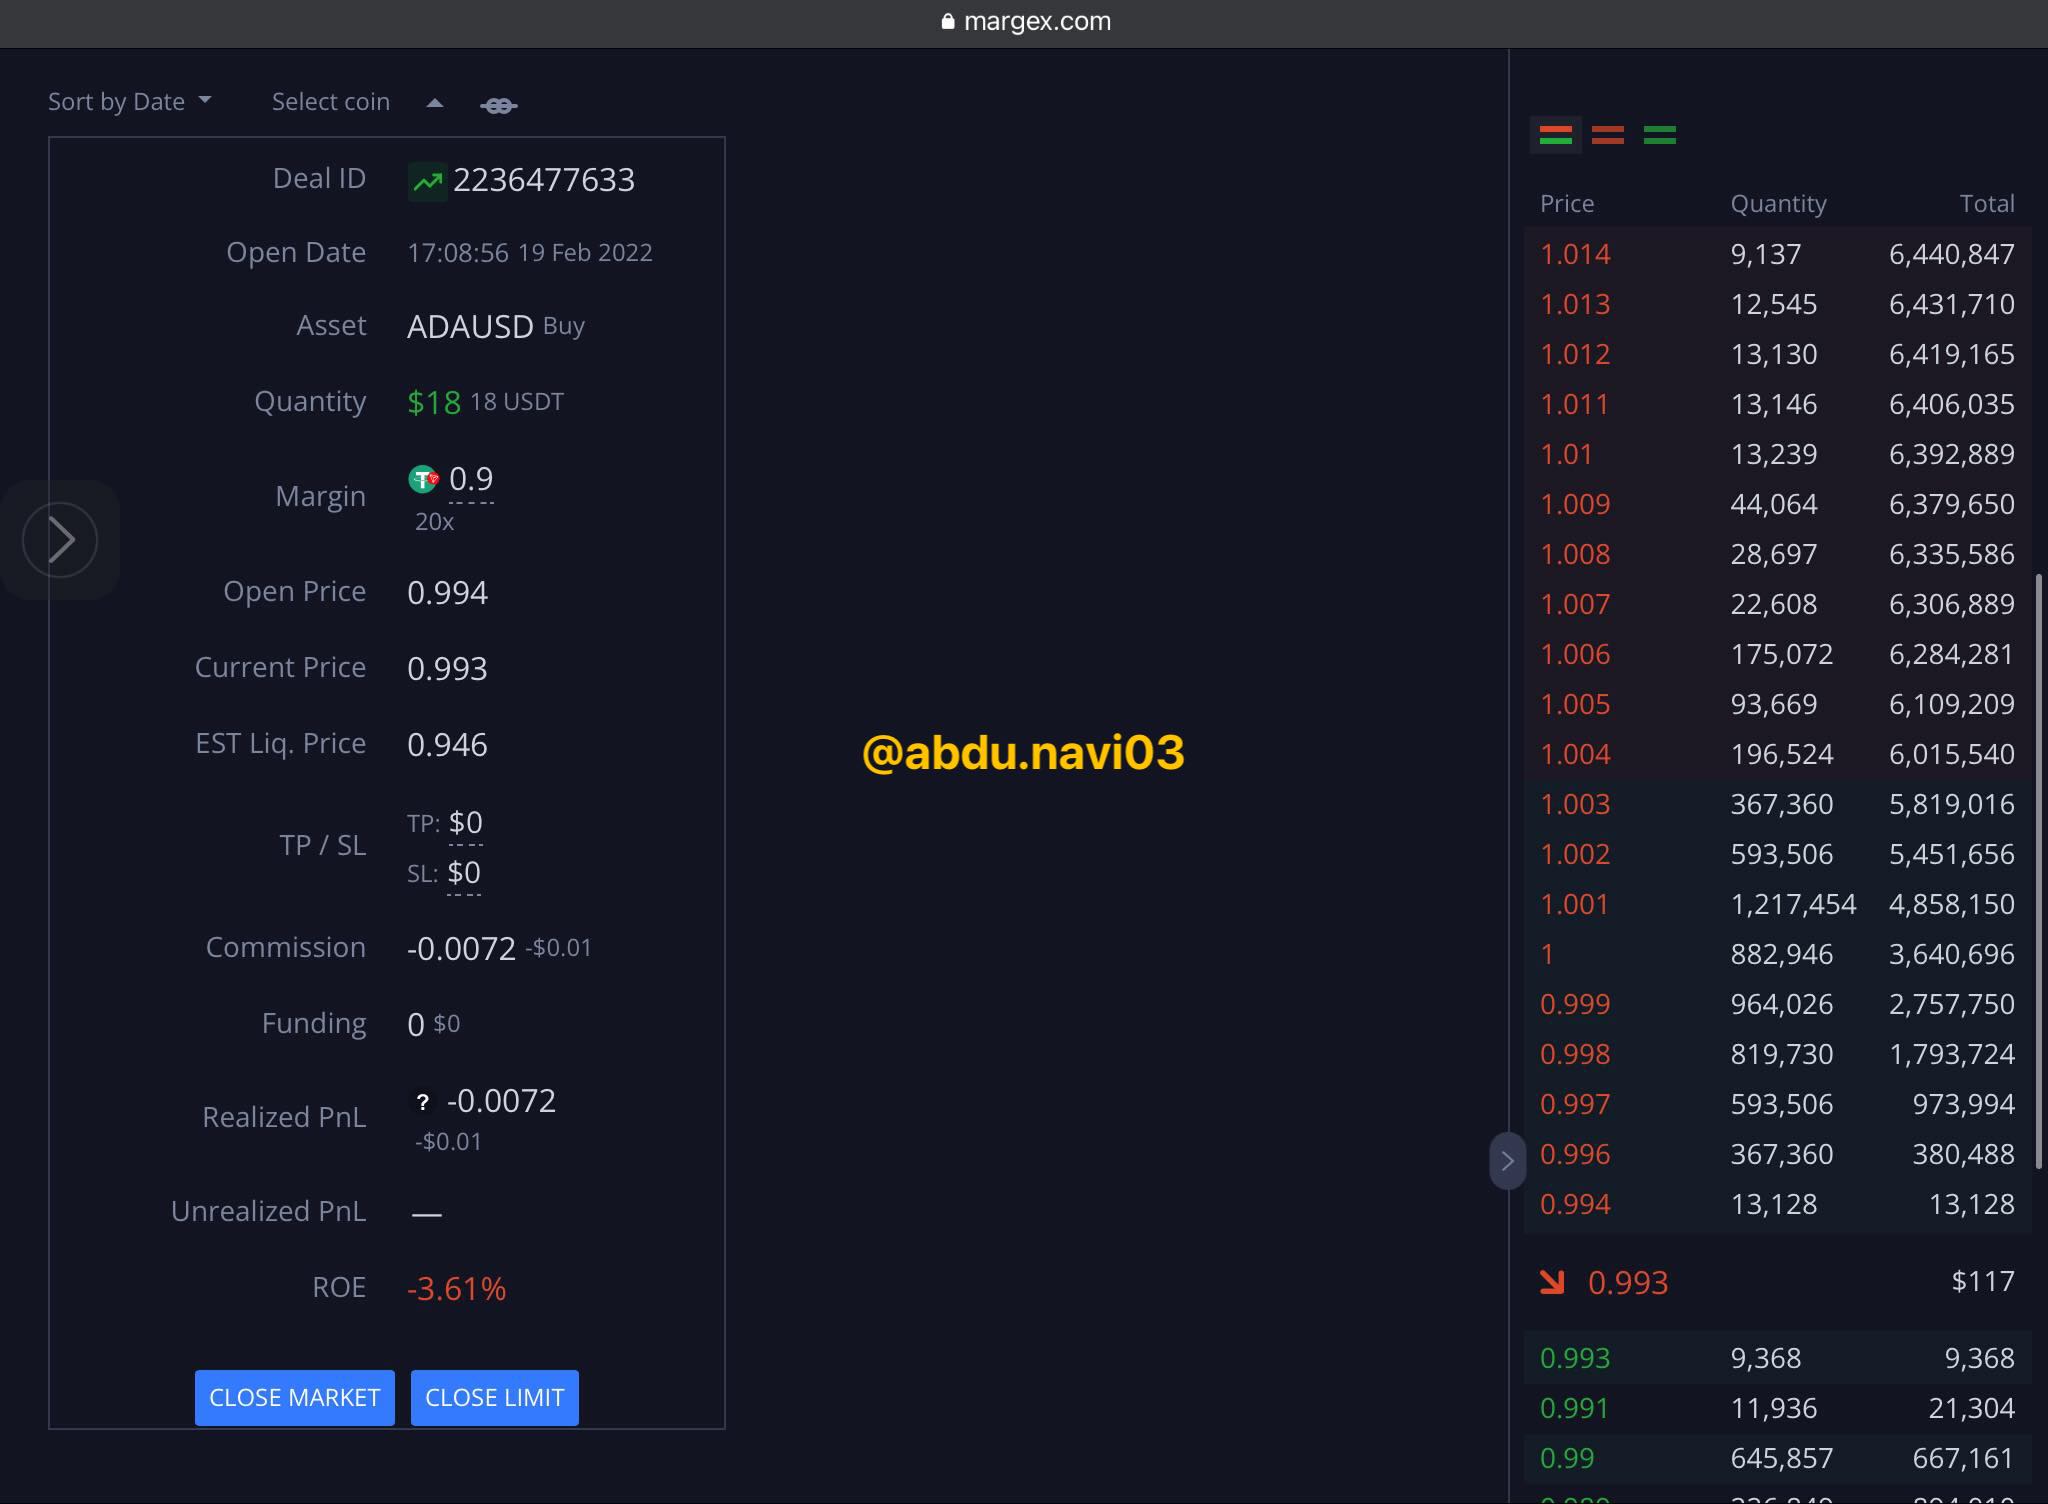
Both of my trades are going on still, neither the stop loss nor the take profit has hit to show you the end of the trade.
ADVANTAGES
TEMA has many advantages, few of them are
1-FAST
TEMA is faster than other MAs. When others are just adjusting through the price, TEMA is already generating the signal.
2-SUPPORT AND RESISTANCE
It produces, dynamic support and resistance in the market. That can help traders a lot, as they don’t have to wait for static support and resistance and dodge from wig fishing.
3-CROSSOVER STRATEGY
Two TEMAs with the Crossover strategy work great and are a very great tool to filter trends with this indicator.
DISADVANTAGES
There are many disadvantages too in this strategy.
1-FAST
As it is very fast, little volume change in the market in short time frames can change its direction
2-DYNAMIC SUPPORT AND RESISTANCE
Price doesn’t always work with dynamic support and resistance forms by the TEMA
3-LAGGING REMOVING
As the lagging signals are removed, this introduces also false signals.
CONCLUSION
TEMA is a very good indicator. One thing you’ll notice is that I used the same advantages and disadvantages headings two times. It explains that the trader can earn from it and lose from it. It only depends on its understanding of the market and the indicator. In trend catching, its crossover strategy is best and will be in my very good books for so long for sure. I thank the professor for this brilliant strategy to share with us on this tremendous platform.
That's the end of my assignment. I hope you were able to grasp the basics of my assignment.
Thankyou
ps: All the pictures have been sourced accordingly. The grammar was checked from grammarly.com while the markdowns have been done according to the Markdown Styling Guide.
Cc;
professor @fredquantum
regards,
@abdu.navi03