Steemit Crypto Academy Season 6 Week 4 : CRYPTO TRADING STRATEGY WITH MEDIAN INDICATOR
Hello everyone. How are you all? I hope so fine. I'm good too. So welcome students to week 04 of the 6th season of the Steemit Crypto Academy. This week we are going to learn about an indicator named Median. So without any further delay, let's start the topic,
CRYPTO TRADING STRATEGY WITH MEDIAN INDICATOR
WHAT IS MEDIAN INDICATOR
Before jumping into the understanding of the Median indicator, let’s first discuss what are indicators and why they are used. Any market, whether stocks, forex, or crypto move by the people or the inflow or outflow of money. This inflow or outflow of volume is visible on charts and there are various charts. Upon the visible data, mathematical calculations of different types are done to try to predict the future move of the market. The market behaves like it, that’s the real plus point.
MEDIAN INDICATOR
The median indicator is a trend-based, trend-catching indicator. It measures the market direction and volatility to some extent. Simply, it displays the median value of high and low of a specific length of the chart. For this, it uses ATR(Average True Range). It constitutes a thick median line, acting as a moving average and giving purple color and green color while indicating bear or bull market respectively. Actually, the green band appears when the median line passes above the EMA of the same length and the purple band appears when the median line passes below the EMA of the same length.

HOW TO APPLY INDICATOR
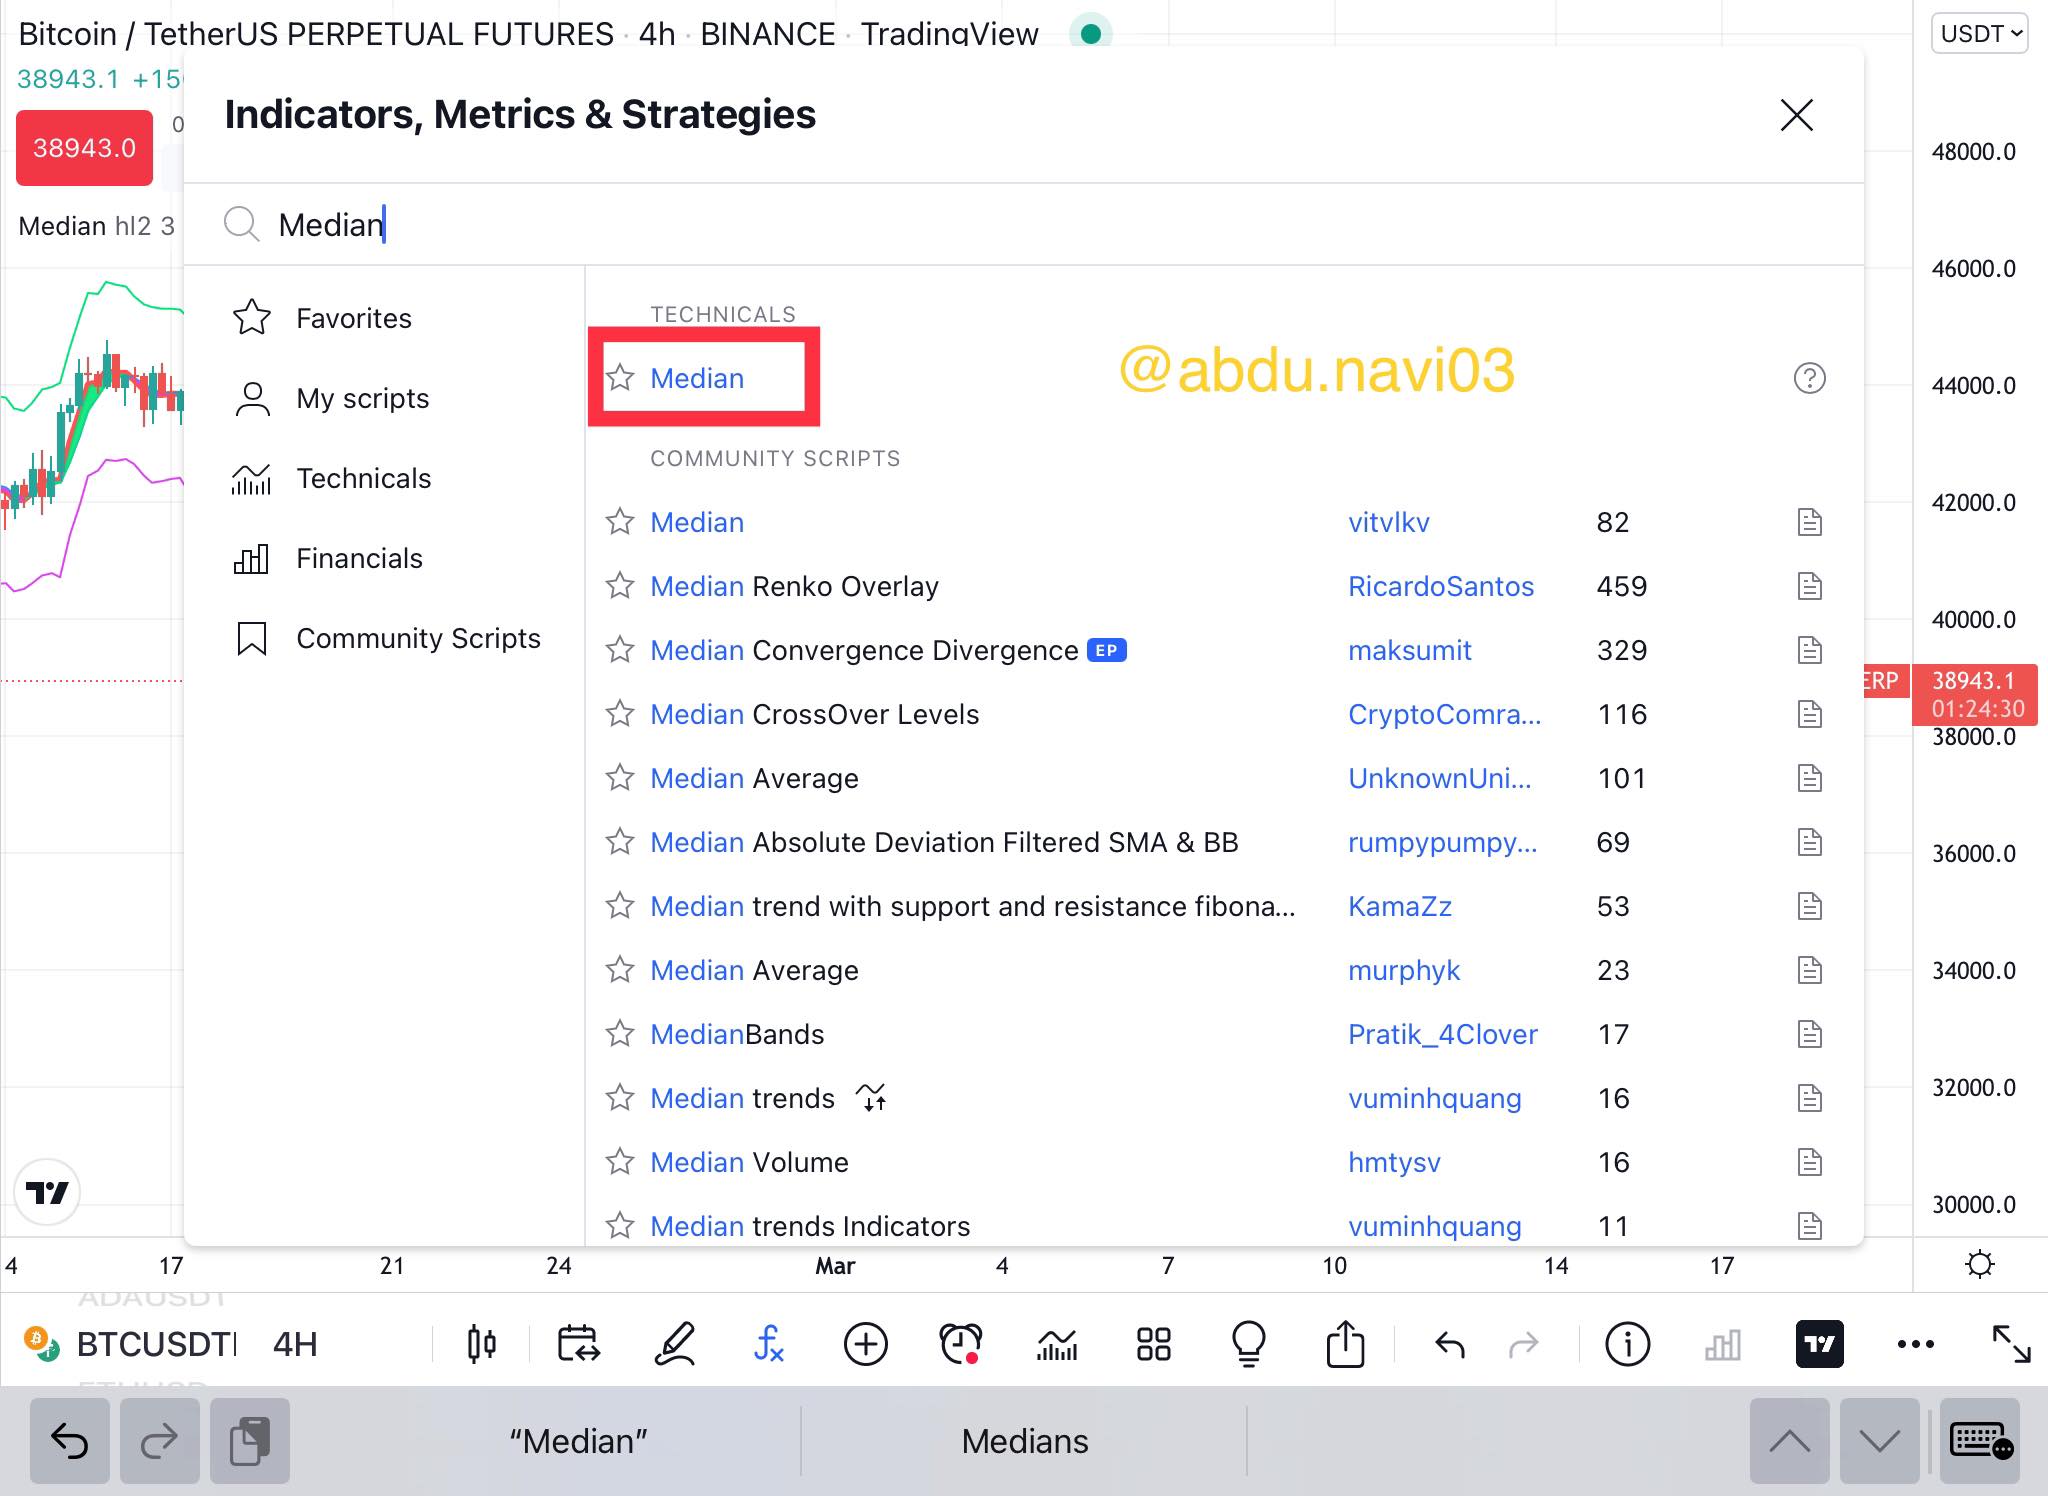
As you can see I’m using tradingview application, here from indicator sections, I applied the median indicator.
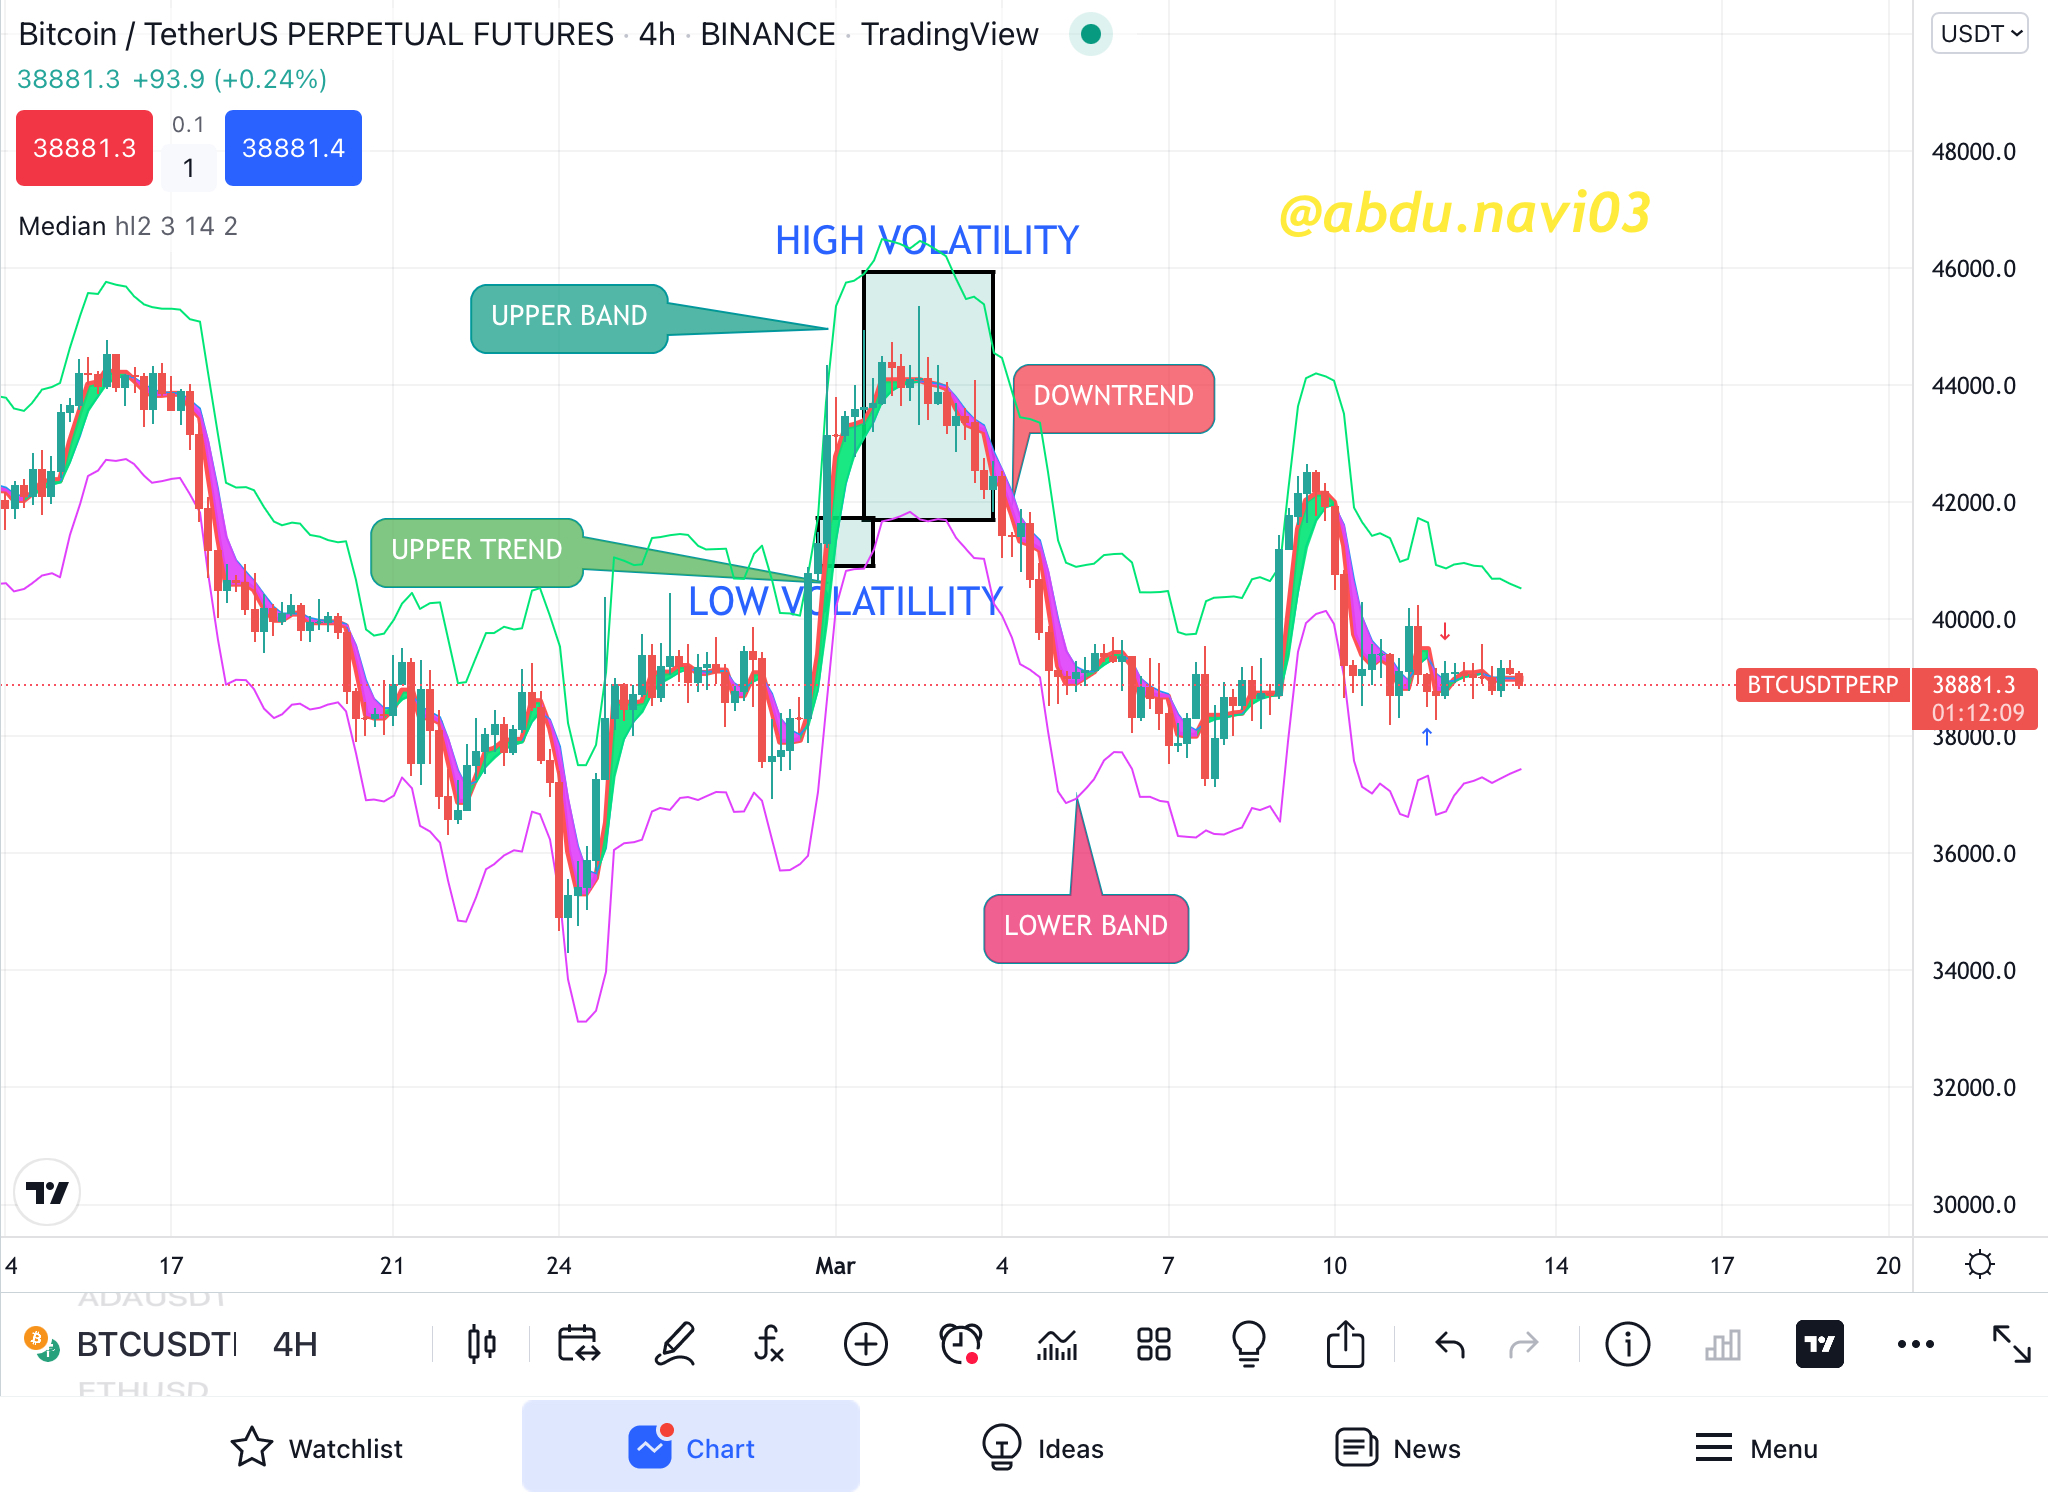
In this screenshot everything is clearly mentioned the upper band, lower band, uptrend, downtrend, high volatility, and low volatility indicates by this indicator.
BUY ENTRY FROM THIS INDICATOR
This indicator is a trend-based indicator. Therefore the buying or selling signal is also a trend indicator. This indicator's real benefit is, that it is trend-based, a trending market is a market where traders make most of their money.
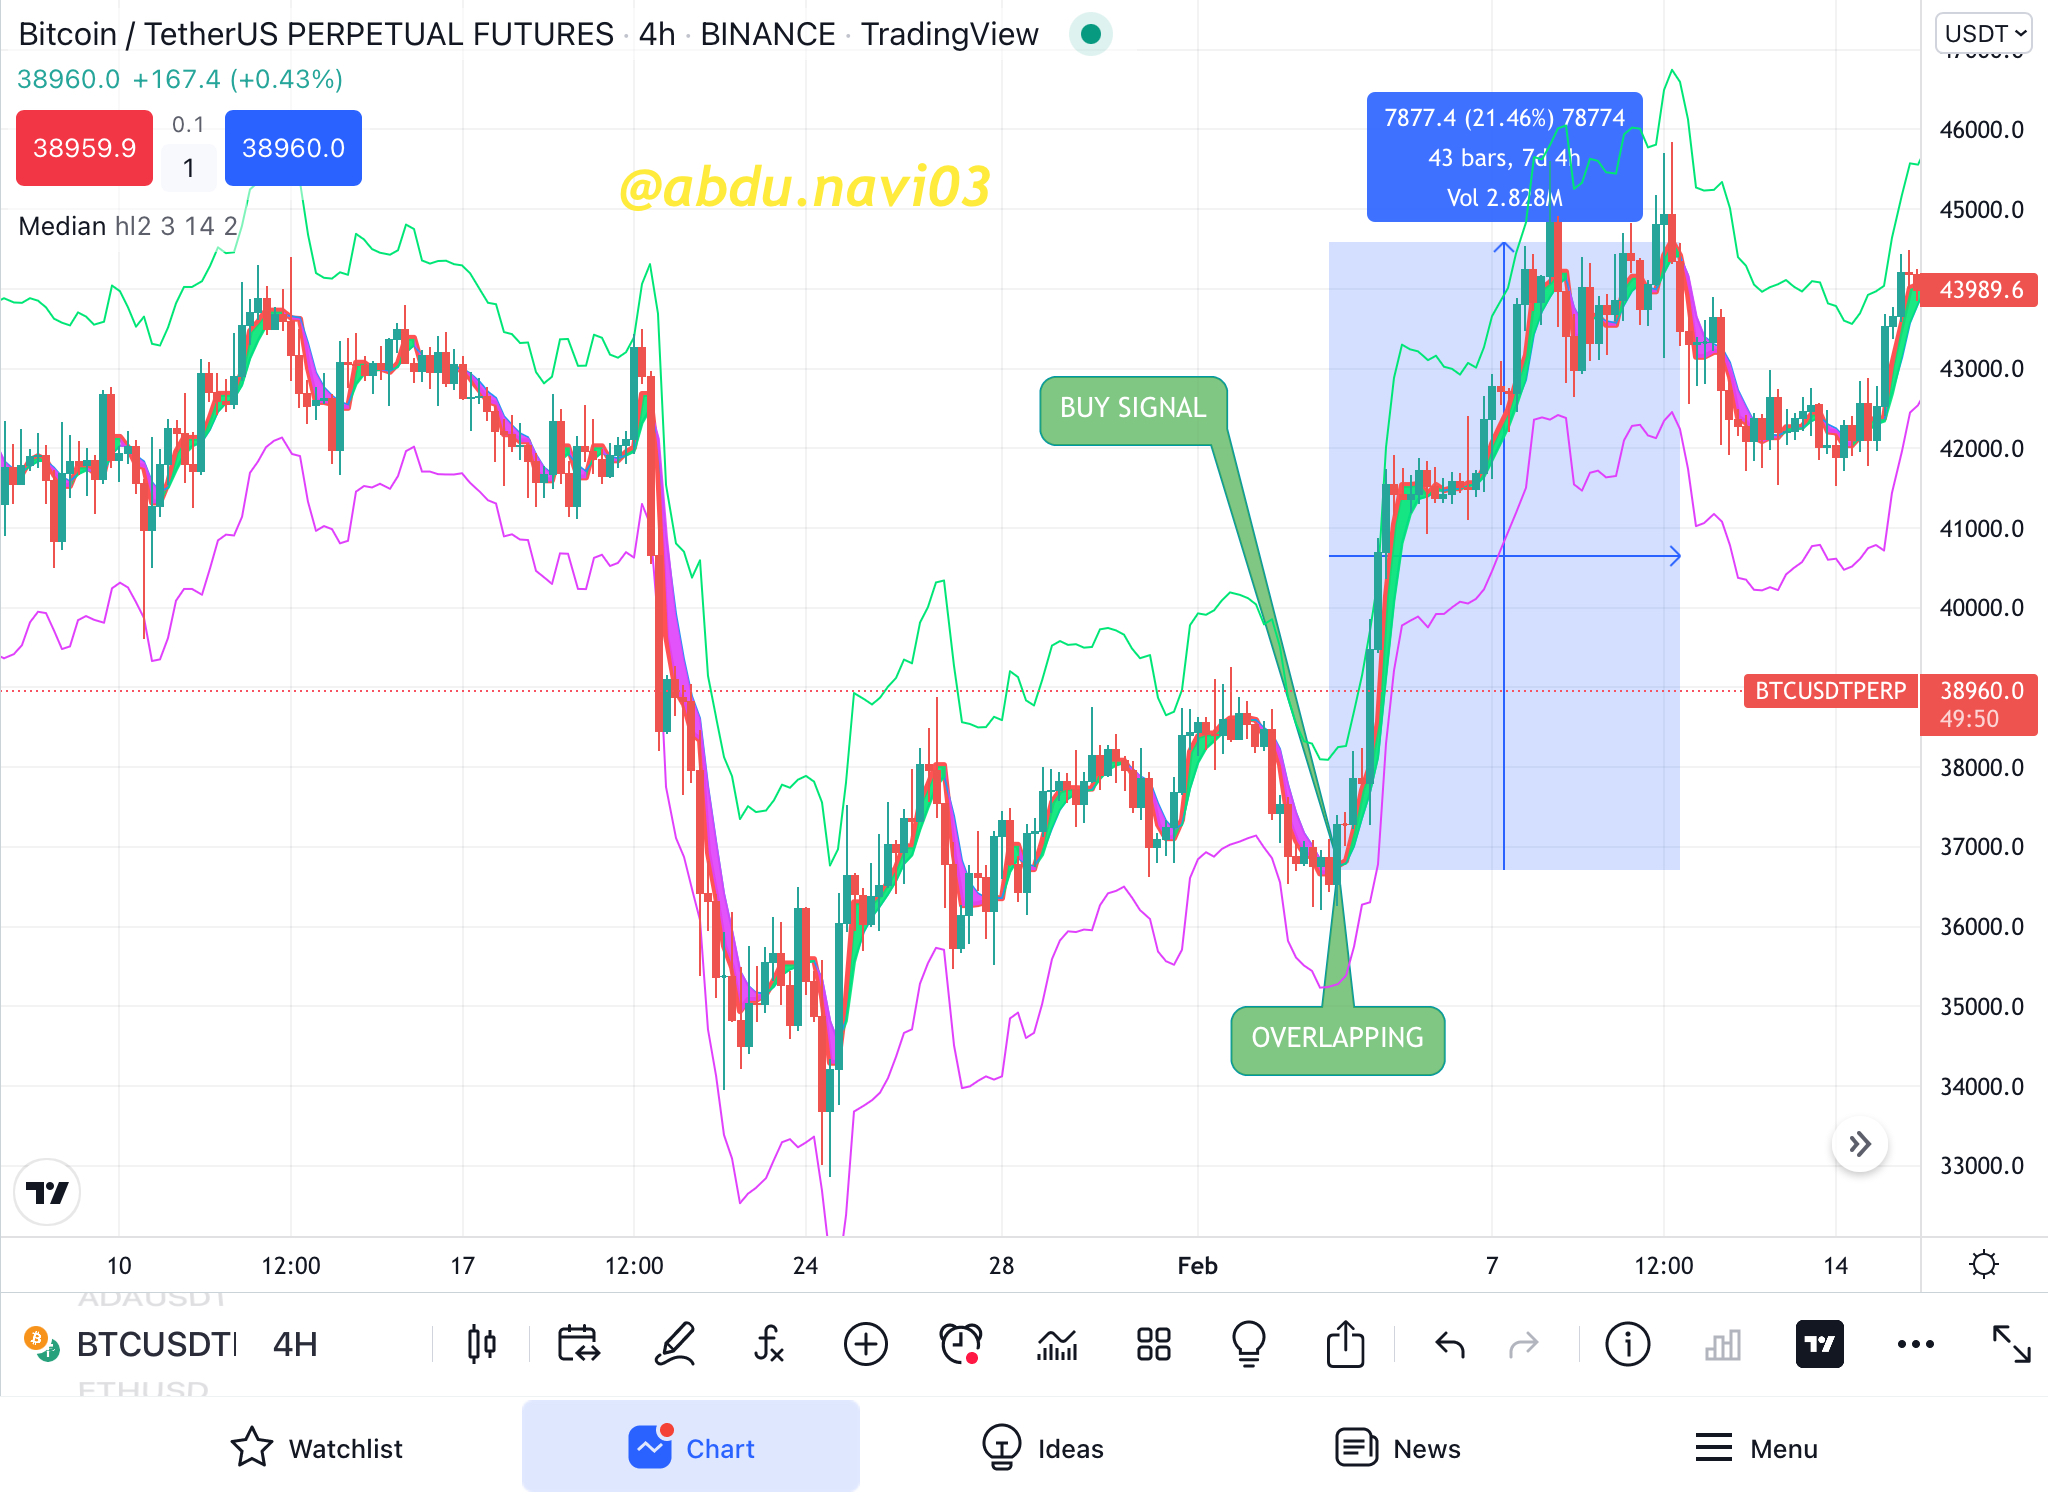
In this screenshot, it is clear when the band turns green, it is the buy signal. And as it is a trend indicator it continues until the trend end. That means not a fixed percentage there is about TP or SL. The occurrence of the purple band is an indication of the ending of the trend. And it should be your TP or SL.
SELL ENTRY FROM THIS INDICATOR
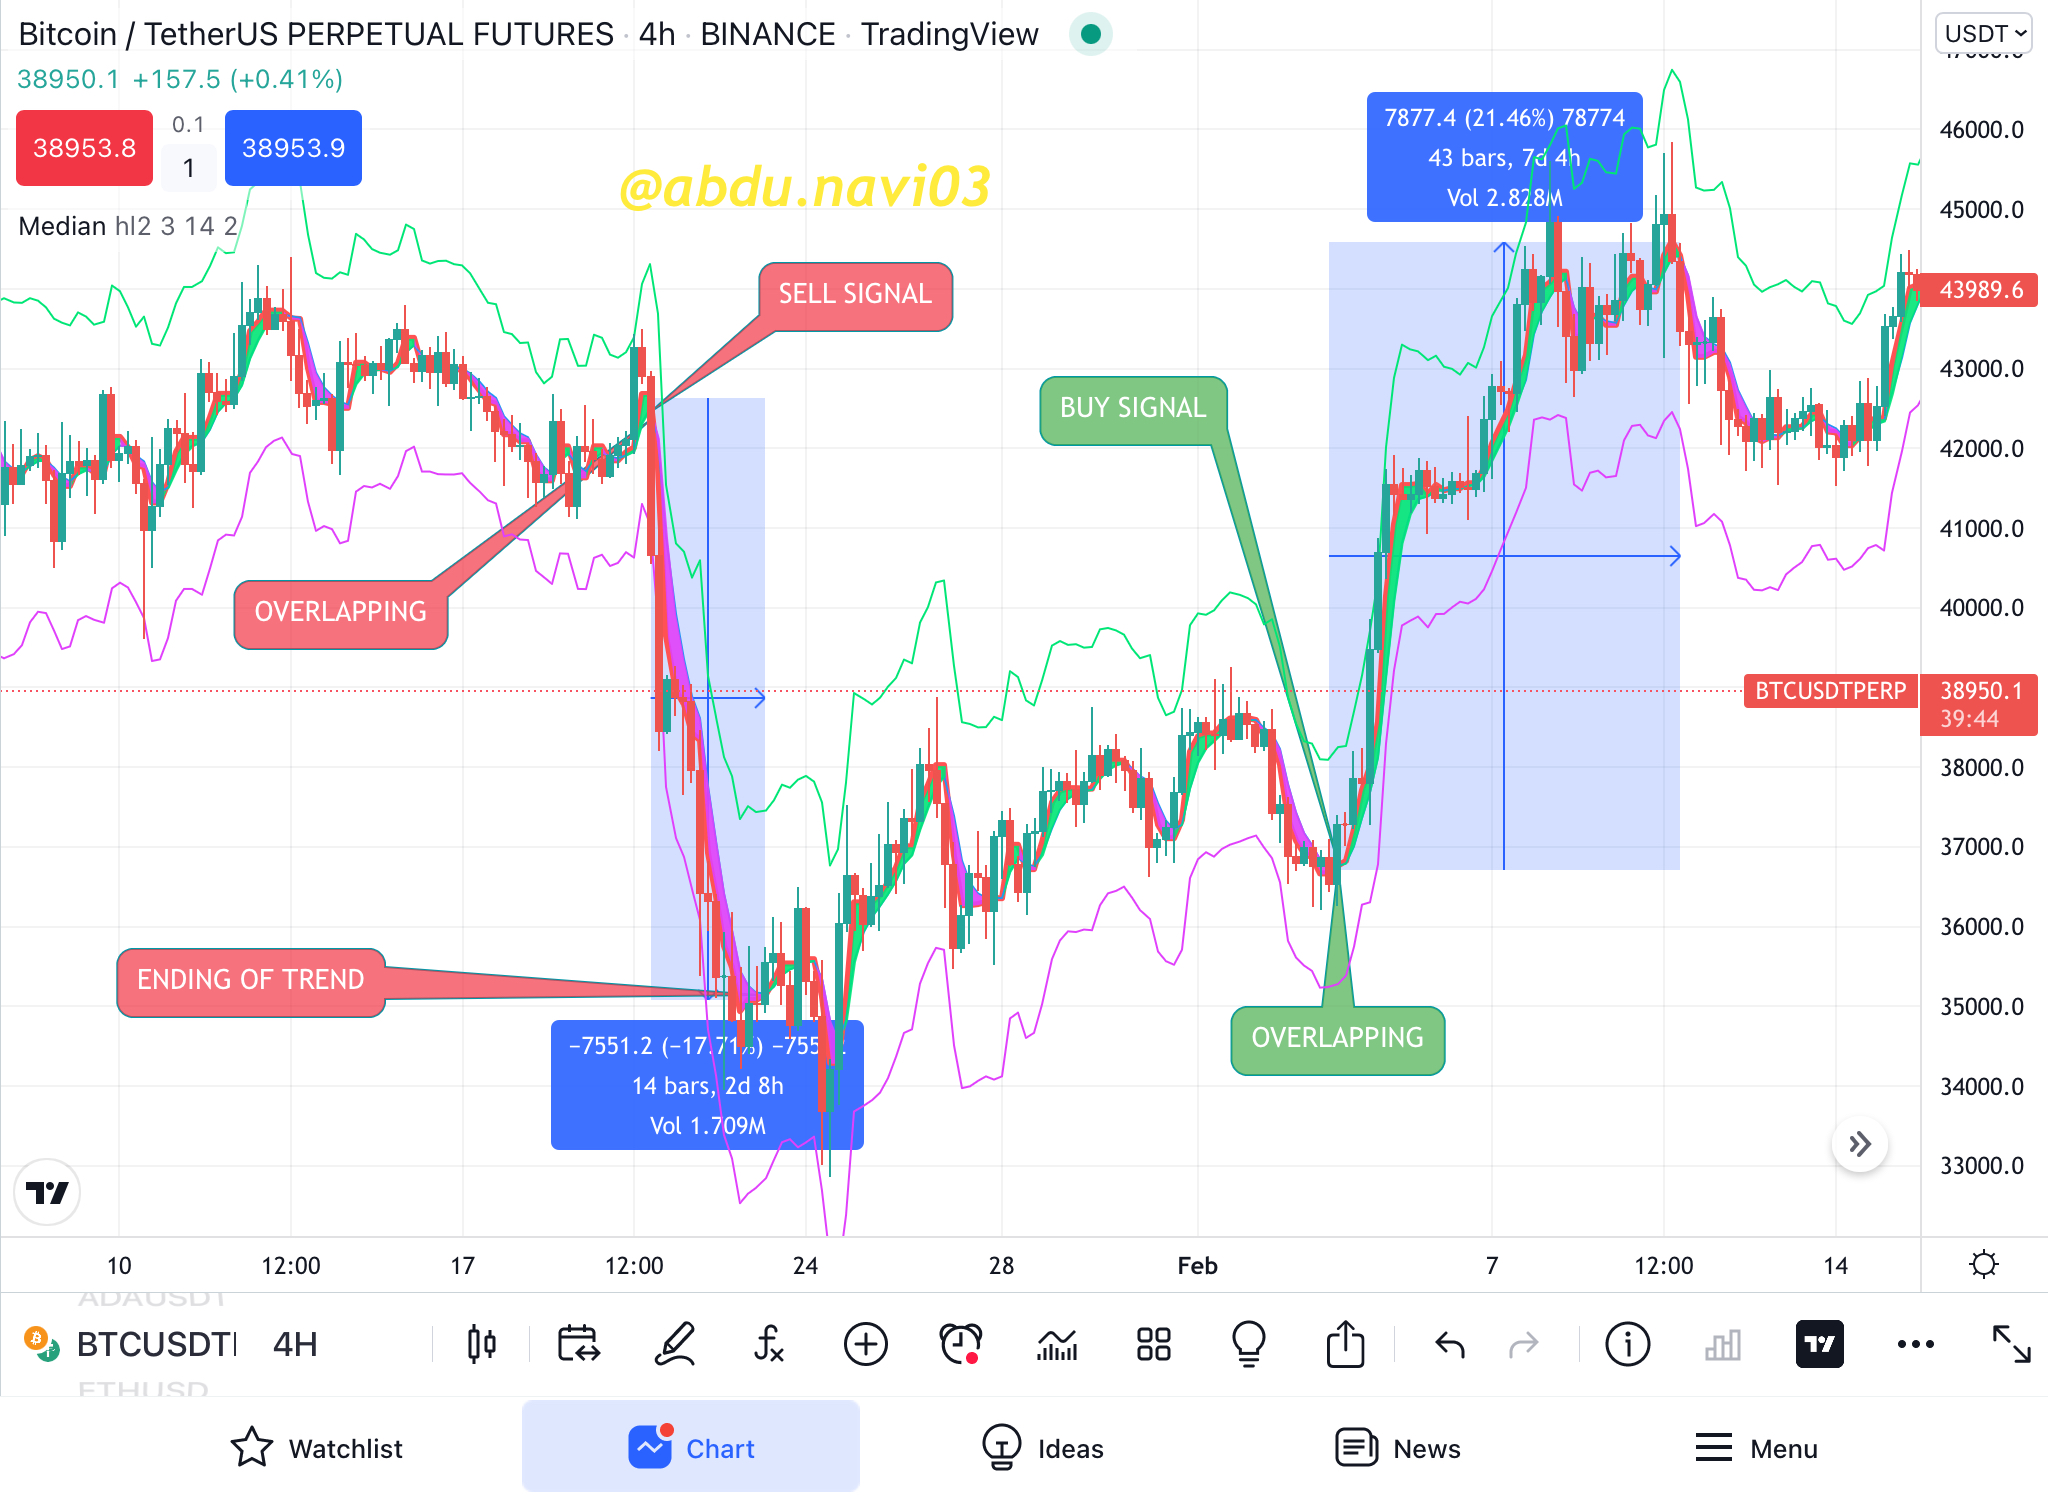
In this screenshot, it is clear when the band turns to purple/pink, it is a sell signal. And as it is a trend indicator, it continues until the trend ends. That means not a fixed percentage there is of TP or SL. The occurring of the green band is an indication of the ending of the trend. And it should be your TP or SL
IDENTIFYING FALSE INDICATOR
This indicator, as it is a trend-based indicator, can be used with that indicator that is not trend-based, to identify their wrong signals. And dodge from wrong trade openings. Such as signals from RSI.
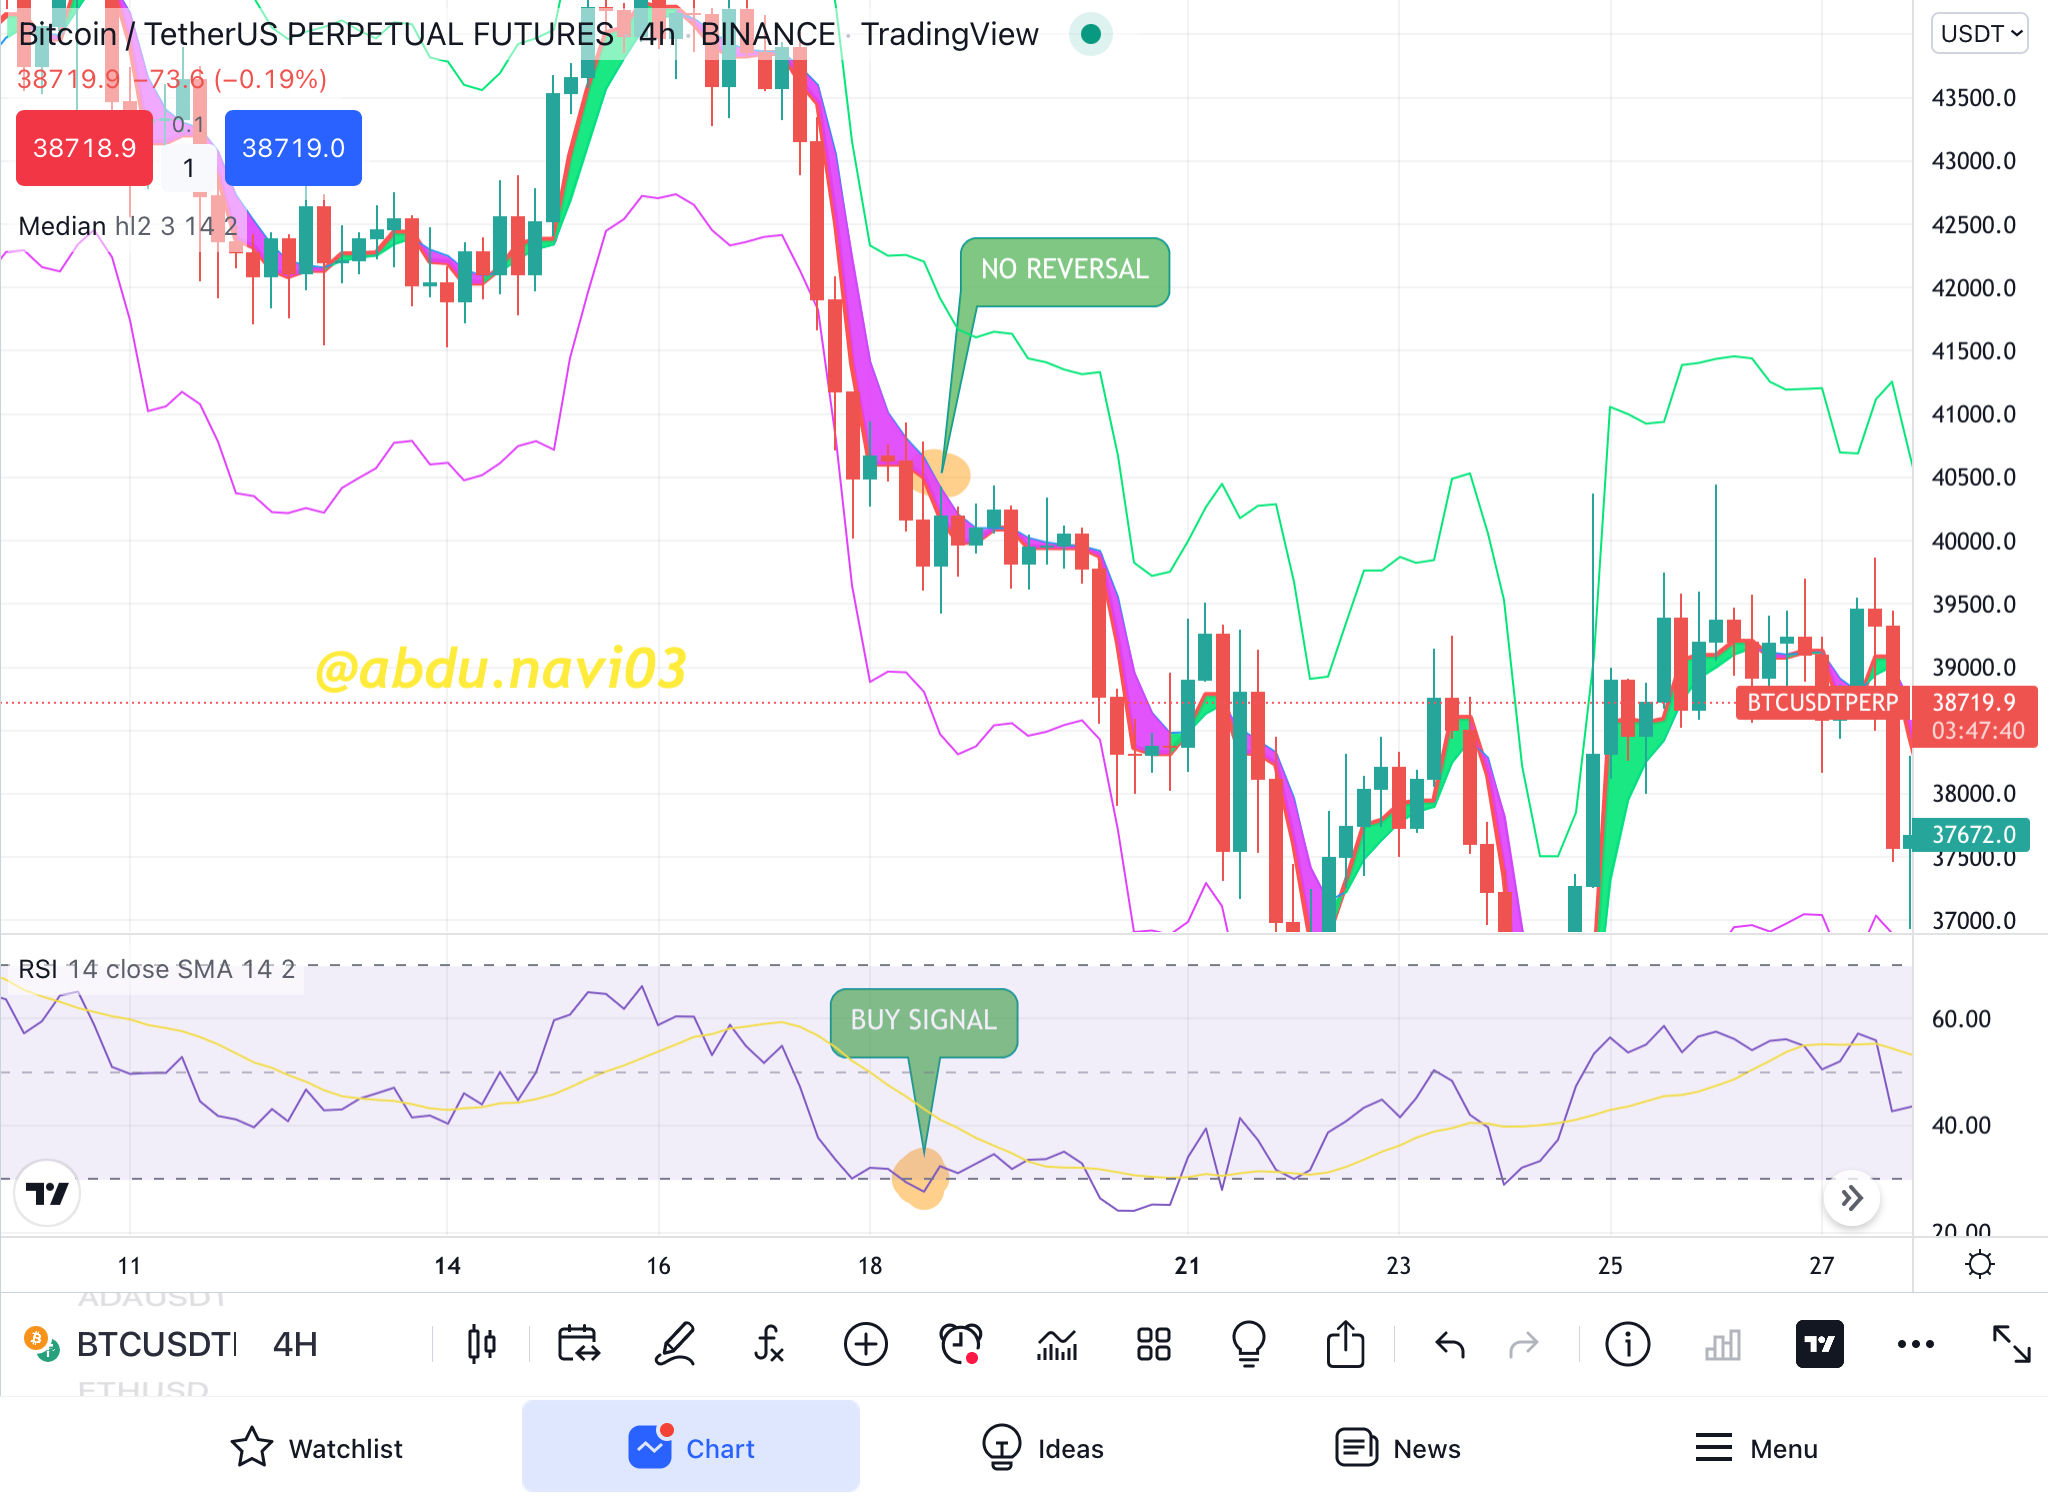
In this screenshot, it is clear how will this indicator will work and identify the wrong signal by RSI. When RSI gives the signal, watch and take a trade when the band changes, if it doesn’t, do not take the trade.
CONCLUSION
Indicators are tools that analyze the data and predict the future flow of the market. They are very prone to any news or whale. Therefore almost every indicator is for long time frames usage. Specially trend-based indicators. Because you want your trade to be open for a month but must win more than 20%. Long time frames give perfections in indicator, make you less prone to whales wigfishing and in more profit at least in the crypto market. The Crypto market’s volatility grants it this feature.
HOMEWORK
1-Explain your understanding with the median indicator.
2-Parameters and Calculations of Median indicator. (Screenshot required)
3-Uptrend from Median indicator (screenshot required)
4-Downtrend from Median Indicator (screenshot required)
5-Identifying fake Signals with Median indicator(screenshot required)
6-Open two demo trades, long and short, with the help of a median indicator or combination that includes a median indicator (screenshot required)
GUIDELINES
Be sure to post your assignment in the Steemit Crypto Academy Community
Before making a post read thoroughly the lesson
Add proper tags for this assignment including #abdu-s6week4, #cryptoacademy, and also don't forget to add the tag #club5050 if you are eligible for it. You can also add some other tags such as #median and #indicator. Also, add the tag of your country, eg mine is #pakistan
Your assignment must contain at least 600 words
Don't forget to add the reference and source of the images used in your assignment and there should be your username as a watermark in every screenshot you use in the assignment.
You may also tag me in your assignment when you post it. (@abdu.navi03)
You may create your Homework Title like [CRYPTO TRADING STRATEGY WITH MEDIAN INDICATOR]- Steemit Crypto Academy- Homework post for Professor @abdu.navi03 by (your username)
Plagiarism will not be tolerated at any cost so try to be creative and unique and look out for originality.
Your account must not be in a power-down process and you must have a minimum SP of 450 and a reputation level of 60 in order to be eligible for grading.
Also buying votes from bots is not allowed in the Steemit Crypto Academy so try to avoid it or otherwise you will not be graded.
Your Homework task must be submitted before 11:59 pm(GMT)on Saturday and for Pakistani users, it is 4:59 am Sunday
If you are not graded after the 48 hours of the submission of your assignment, you can drop the link of the assignment in the comment section of this post. But before that wait, your assignment will be graded, and try to avoid spam commenting.
After all of this, if you have any questions regarding my lesson, you are most welcome to ask in the comment box.
regards,
Professor @abdu.navi03
cc;
@steemitblog
@steemcurator01
@steemcurator02

Good evening professor.
Below is my entry;
https://steemit.com/hive-108451/@tayetaiwo/trading-strategy-with-median-indicator-steemit-crypto-academy-or-s6w4-or-homework-post-for-professor-abdu-navi03
Please can you give further explanation of the question 2 ?
The Calculations and parameters.
Hello professor please review this @abdu.navi03
https://steemit.com/hive-108451/@kingcent/crypto-trading-strategy-with-median-indicator-home-work-post-for-abdu-navi03
Hello prof @abdu.navi03 my homework post is yet graded and past 48 hours
https://steemit.com/hive-108451/@favrite/steemit-crypto-academy-season-6-week-4-homework-post-for-prof-abdu-navi03-crypto-trading-strategy-with-median-indicator
Hello professor @abdu.navi03 please review this
https://steemit.com/hive-108451/@kingcent/crypto-trading-strategy-with-median-indicator-home-work-post-for-abdu-navi03
Hello Professor @abdu.navi03, please my entry.
[CRYPTO TRADING STRATEGY WITH MEDIAN INDICATOR]- Steemit Crypto Academy- Homework post for Professor @abdu.navi03 by @justiceanietie
Hello prof @abdu.navi03 it’s 2days already, my work is yet to be graded by you. Below is the link
https://steemit.com/hive-108451/@merci26/crypto-trading-strategy-with-median-indicator-steemit-crypto-academy-homework-post-for-professor-abdu-navi03
What a lesson ...
Nice lesson length here❤️
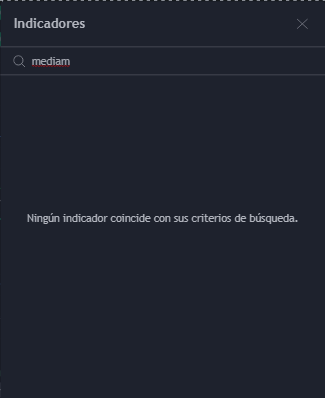
saludos profesor. Este indicador esta disponible en binance? trato de buscarlo y no se refleja
Greetings Prof please you forgot to review my post. Here's the link
https://steemit.com/hive-108451/@tenguhatanga/crypto-trading-strategy-with-median-indicator-steemit-crypto-academy-homework-post-for-professor-abdu-navi03-by-tenguhatanga-15