[Trading with Accumulation / Distribution (A/D) Indicator] - Steemit Crypto Academy Season 4 Week 5| Homework Post for @allbert
%20Indicator..png)
Introduction
Hello to everyone,
Our topic this week is the A/D indicator, which is an indicator created using price and trading volume, based on the fundamentals of technical analysis and market cycles. The professor shared a lot of information about the A/D indicator with us in his lecture. In this post, I will fulfill the assignments given by the professor. Let's start!

Question 1
Explain in your own words what the A/D Indicator is and how and why it relates to volume. (Screenshots needed).
Accumation / Distrubution (A/D)
As we all know, all living beings in the world are in a certain cycle. All living things are born, grow and die. It has certain cycles in the market, just like living things. There are many indicators that study these cycles.
E.g; According to the Dow Theory, which is one of the foundations of technical analysis, the market has four phases. These four phase states give traders the homes of the rise and fall of financial assets. These; It is the accumulation phase, the rise phase, the distribution phase and the fall phase.
For the A/D indicator, this situation is evaluated as two phases. As Accumulation and Distribution. Now let's take a look at the meanings of these words on the market.
Accumulation
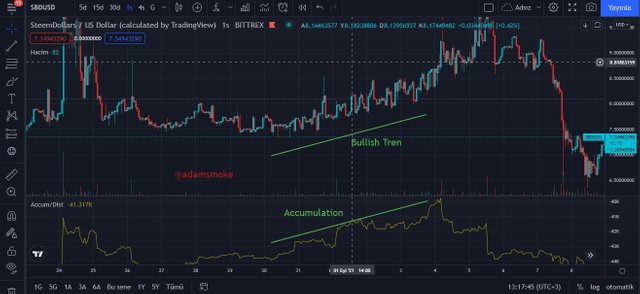
Real life savings; is to buy any asset and hold it in our hands. It is no different in accumulation on the market. Holding financial assets by purchasing them is called savings. At the time of accumulation; According to the law of supply and demand, an increase in the price of the asset occurs. We can see this more clearly on a graph.
Distribution
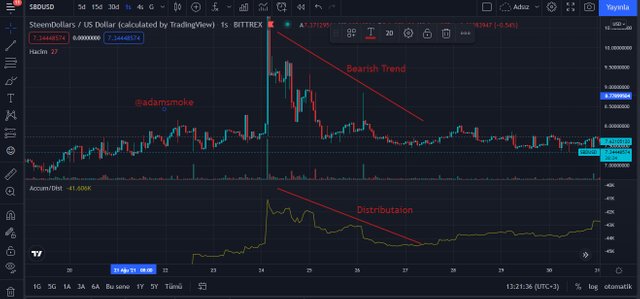
In real life, distribution means throwing away (selling) an asset that you own. It is no different in distribution on the market. Traders with financial assets dispose of (sell) that asset. During this distribution, as in the same accumulation; According to the law of supply and demand, there is a decrease in the price of the asset.
At this point, the A/D indicator came to life in the hands of a famous trading guru, Mark Chaikin. It is used to measure the Accumulation and distribution on the market and gives us information about what cycle the market is in. However, the trick that we should pay attention to in this indicator is; It gives information about when the cycle on the market will end. In this way, it helps us during our trade and enables us to do a healthier trade.
In general, in the price chart of asset pairs; It is below the price.
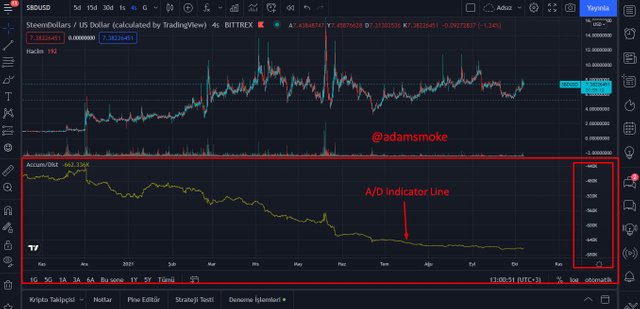
- As you can see in the screenshot above, our A/D indicator is located under the price chart and consists of two elements; It consists of the A/D Line and the Scale section just to the right.
It is a momentum indicator that combines trading volume and price movements on the basis of the A/D indicator, and volume is used when calculating. The A/D indicator combines trading volume and price movements (We will see this more clearly in Question 3). Because the higher the transaction volume, the stronger the change on the price will be; It gives us ideas about whether there is a trend on the market, whether the trend is an uptrend or downtrend, and whether the existing trend will continue.

Question 2
Through some platforms, show the process of how to place the A/D Indicator (Screenshots needed).
There are many platforms that support the A/D indicator. In this section, I will use the Tradingview platform.
- The first thing we need to do is log in to the Tradingview platform.
- Then we open the price chart of an asset I want.
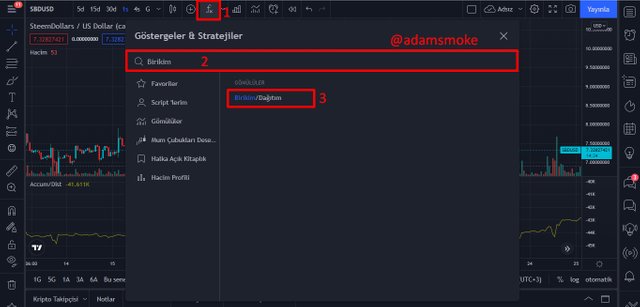
As you can see in the screenshot above;
- Click the Indicators (Fx) button at the top. (Box 1)
- It is enough to write “Savings” in the search section of the pop-up window that appears later. (Box 2)
- The next result is usually one, as you can see in the screenshot. Then, we click on the Accumulation/Distribution option from the results. (Box 3)
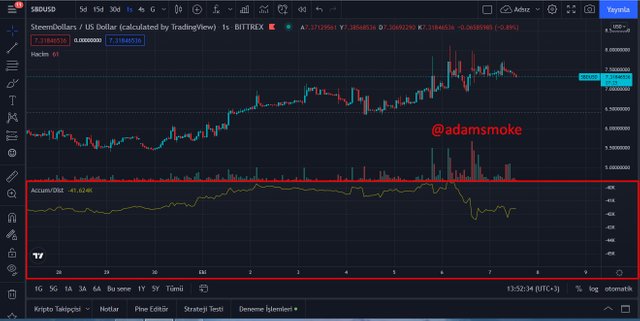
- Then our indicator is successfully added to our chart. We can see this in the screenshot above.

Question 3
Explain through an example the formula of the A/D Indicator. (Originality will be taken into account).
Almost every indicator is based on certain mathematical formulas. While many of these formulas are easy to calculate, many are difficult. For this reason, indicators are generally calculated by computers and easily placed on our chart.
When calculating the A/D indicator, we will need a different formula. These;
1. Money Flow Multiplier (MFM)
[(Close Price – Low Price) – (High Price – Close Price)] / (High Price – Low Price)
2. Money Flow Volume
Money Flow Multiplier X Period Volume
3. A/D Line
Previous A/D + Current Period Money Flow Volume
Now let's show these formulas on an example.
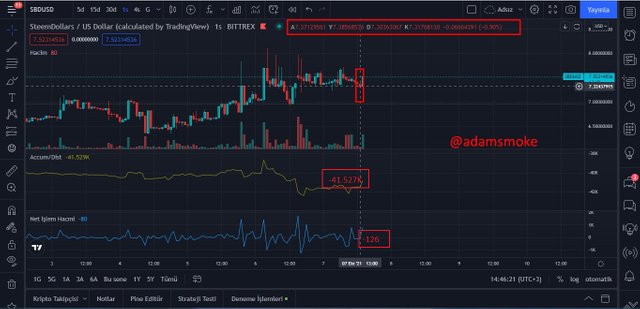
- As you can see in the screenshot above, we can easily access the price information of the candle we selected earlier from the top of the screen.
Opening Price: 7.3712 USD
High Price: 7.3856 USD
Low Price: 7.3036 USD
Closing Price: 7.3176 USD
- Again, as we can see below the screenshot, the trading volume of the candle we selected and the A/D values of the previous period can be seen.
Transaction Volume: -126
Previous A/D: -41.527K
Now we can move on to our calculations based on this information.
- First we calculate our MFM value.
** MFM = [(Close Price – Low Price) – (High Price – Close Price)] / (High Price – Low Price)**
MFM = [(7.3176 – 7.3036) – (7.3856 – 7.3176)] / ( 7.3856 – 7.3036)
MFM = 0.6585
- Secondly, we calculate our Money Flow Volume.
Money Flow Volume = Money Flow Multiplier X Period Volume
Money Flow Volume = 0.6585 X -126
Money Flow Volume = -82,971
- Finally, we calculate our A/D value.
A/D = Previous A/D + Current Period Money Flow Volume
A/D = -41.527K + -82.971
A/D = -41609,97 K

Question 4
How is it possible to detect and confirm a trend through the A/D indicator? (Screenshots needed)
If we carefully examine our indicator after adding it to our chart, we will see that it progresses in direct proportion to the price action. (Excluding Deviations)
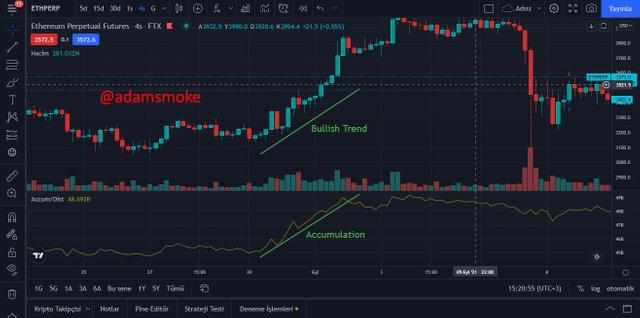
- As we can see in the screenshot above, when the price is in Bullish Trend; Our A/D indicator is bullish and the market is in the Accumulation phase.
Bearish Trend
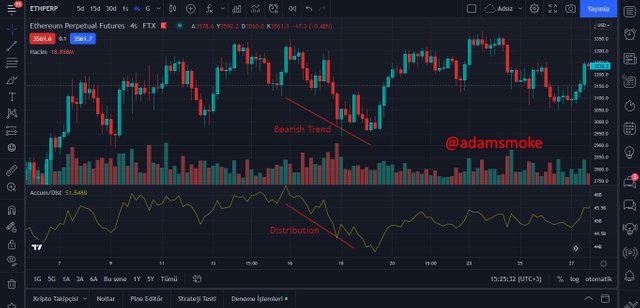
- As we can see in the screenshot above, when the price is in a Bearish trend; Our A/D indicator is also down and the market is in the Distribution stage.
Divergence Trend
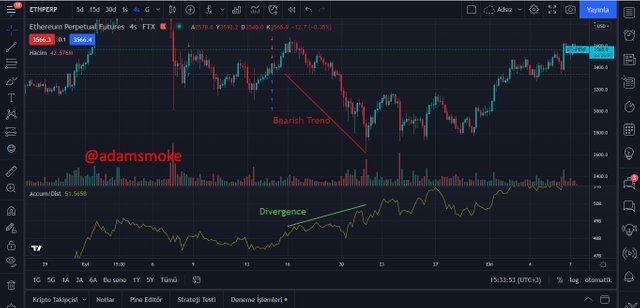
- As can be seen in the screenshot above; While the price is showing a decline, our A/D indicator continues to rise and there is a discrepancy between them.
This divergence situation is actually the most important point of this indicator. Because when taking a position, we usually follow these conflicts and take a position accordingly.
This divergence situation tells us; indicates that the strength of the trend on the market is decreasing and means that a trend change is likely. As you can see in the screenshot, the price starts to rise again after a while.

Question 5
Through a DEMO account, perform one trading operation (BUY or SELL) using the A/D Indicator only. (Screenshots needed).
When you read the professor's lecture and my post, we can understand that;
What the A/D indicator does is actually follow the price action like many other indicators do. However, as we have said before, the important thing for us is to find Divergence situations when using the A/D indicator and to take our position in such conflict formations.
For this reason, when looking for a position, first to make sure that we know our entry and exit criteria.
Entry and Exit Criteria
- First of all, we are looking for a discrepancy as we have stated many times before; It's like a mismatch where the A/D indicator rises while the price falls.
- Then we draw a downtrend line on the price and wait for the price to break the downtrend line we have drawn.
- Then we take our position as long.
- Then we place our stop-loss point at the lowest point the price made while in a downtrend.
- Then we adjust our Take Profit level so that the Risk:Reward ratio is not less than 1:1.
ETH/USD Pair Long Position
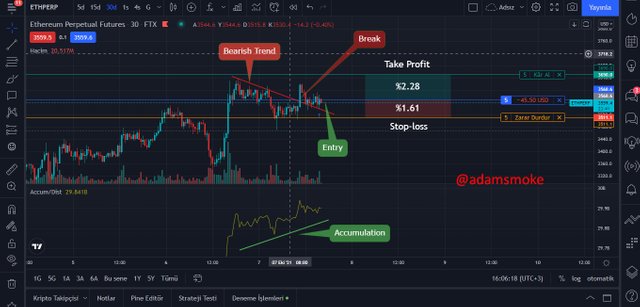
As you can see in the screenshot above, I detect a Divergence. When I look at the chart later, I see that the A/D indicator is rising while the price is falling. Therefore, I thought that this downtrend would run out and I drew my Bearish Trendline and waited for the breakout to happen. Then the breakout took place and after the price correction, I took my position. I then set a Stop-loss level at the lowest point the price made while in a downtrend. Then I set a Take Profit level with a Risk:Reward ratio of not less than 1:1.
Position Details
- Type: Long
- Entry price: 3568.6 USD
- Stop-loss Price: 3511.1 USD
- Take Profit: 3650 USD
- Risk/Reward: 1.42
Note: I was a little late to take my position because; The breakout was sudden and big, so I thought the price would correct and it did. Later, when the price came back to the level where the breakout occurred, I took my position.
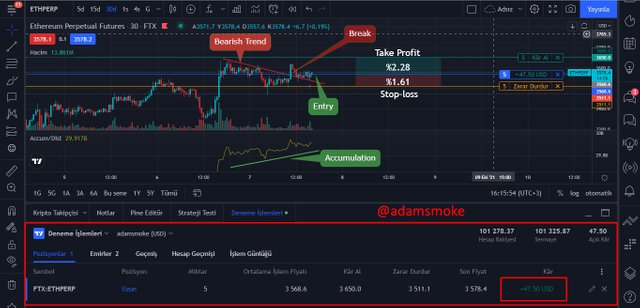
- As I continue to write this post, my position was progressing well.

Question 6
What other indicator can be used in conjunction with the A/D Indicator. Justify, explain and test. (Screenshots needed).
It is always beneficial to use more than one indicator in our trades. Because no indicator shows 100% accurate results. Therefore, as in every indicator, we can make our trade more positive by using confirmatory indicators in the A/D indicator. E.g; EMA, RSI, Volume, etc. We can use indicators.
Using Volume bars with A/D Indicator
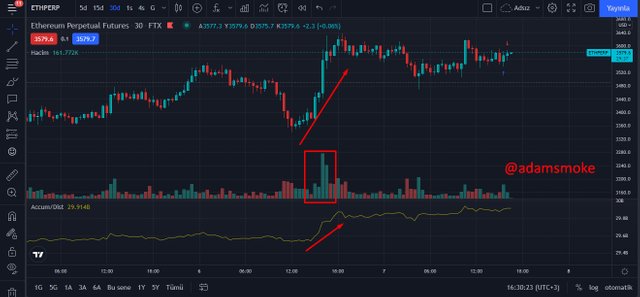
- As we can see in the screenshot above; As the price slowly starts to rise, the value of our A/D indicator starts to rise as well. Exactly at this point, when we look at the Volume bars, we can see successively rising green volume bars. These bars inform us that the market is overbought and that the price will go up.
Using EMA with A/D Indicator
The use of the standard EMA is generally carried out using the indicators EMA55 and EMA21. If we define the EMA55 and EMA21 indicators in the most practical way; It allows us to follow the direction of the trend and receive entry and exit signals. If we explain it more meaningfully and briefly;
- If the price is moving below our EMA lines, the market is in a downtrend.
- If the price is moving above our EMA lines, the market is in an uptrend.
- If the EMA55 line crosses the EMA21 line from the bottom up, i.e. as soon as the EMA55 line crosses above the EMA21 line, it is a Sell signal and means the market will go down.
- If the EMA21 line crosses the EMA55 line from the bottom up, i.e. as soon as the EMA21 line crosses above the EMA55 line, it is a Buy signal and means the market will go up.
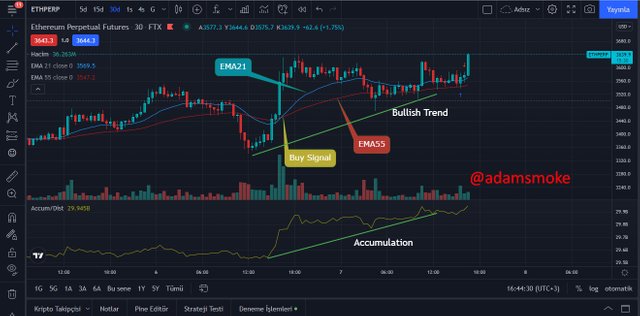
- As we can see in the screenshot above, the EMA21 line crosses the EMA55 line from the bottom up. This gives us a Buy signal as we said before.
- When we look at our A/D indicator later, we see that it has risen in the same way and its price has risen in the same way.
Using RSI with A/D Indicator
The RSI indicator helps us identify Oversold and Overbought zones on the market. If we explain this indicator basically, it has a line that moves between 0-100 values. Generally, when the RSI line drops below 30, it enters the Oversold region, giving us a buy signal. When the RSI line goes above 70, it enters the Overbought region and this gives us a Sell signal.
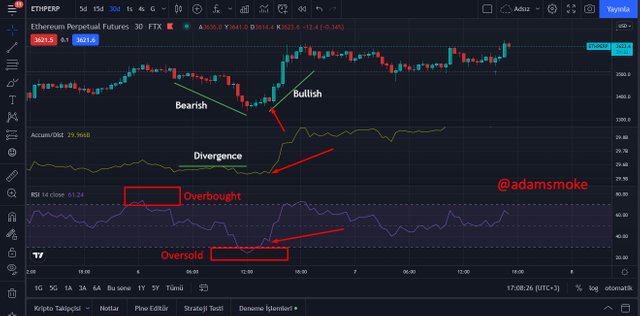
- As we can see in the screenshot above, it is falling and after a while, when we look at the RSI indicator, we see that it has entered the Oversold region.
- At this point, when the price is falling, when we look at the A/D indicator, we see that it moves sideways and this shows us that there is a divergence. This discrepancy informs us that the downtrend is exhausted and that the trend will change direction.
- Next, we are looking for a buy position as the A/D indicator and the RSI indicator give us a buy signal.
- Later, when the RSI value rises above 30, the market starts to change direction and starts to rise.

Conclusion
Our lesson this week was a really good lesson. We have processed the A/D indicator, which many of us did not know before and is very easy to use. I have tried to present to you the information I know and have learned in a simple language as much as I can.
Thank you to everyone who read my post and professor @allbert for this nice lesson. I wish you all a healthy and beautiful day.
Hello @adamsmoke Thank you for participating in Steemit Crypto Academy season 4 week 5.
Thank you for your review, professor. I hope to be more successful in your next lesson. have a nice day
Congratulations! Your post has been selected as a daily Steemit truffle! It is listed on rank 20 of all contributions awarded today. You can find the TOP DAILY TRUFFLE PICKS HERE.
I upvoted your contribution because to my mind your post is at least 8 SBD worth and should receive 40 votes. It's now up to the lovely Steemit community to make this come true.
I am
TrufflePig, an Artificial Intelligence Bot that helps minnows and content curators using Machine Learning. If you are curious how I select content, you can find an explanation here!Have a nice day and sincerely yours,

TrufflePig