Trading with Contractile Diagonals - Crypto Academy / S4W3 - Homework Post for @allbert.
Introduction
Hello to everyone,
The subject of this week is Contractile Diagonal, also known as wedges. Professor @allbert covered the subject in a nice and detailed way. This post is about the assignments of the professor. Let's start.

Question 1
Define in your own words what a contractile diagonal is and why it is important to study it. Explain what happens in the market for this chart pattern to occur. (screenshot required / Bitcoin not allowed)
There are many formations in financial markets. These; triangles, wedges, flags, etc. Our Contractile Diagonal formation is similar to such formations.
In financial markets, after the price reaches a certain saturation, the trend is expected to run out of strength and return. One of the patterns we can see while waiting for the trend to return is our Contractile Diagonal pattern.
The basic working logic of our Contractile Diagonal formation is similar to other triangle and wedge formations as we have mentioned before. In general, the trade structure is an inverse trade model. Well; In a rising market we should look for a Sell position, in a falling market we should look for a Buy position.
The setup model of this formation is similar to Elliot waves. It consists of 5 waves, 1,2,3,4,5 in our model. In our model, our waves 1,3,5 move in the direction of the trend. Waves 2 and 4 move in the opposite direction of the trend.
The way our Contractile Diagonal model works in trade is; After the correct setup of our waves 1,2,3,4,5 in a rising or falling market, the strength of the trend is depleted and then our setup is broken by the price breaking the Contractile Diagonal (wedge) shape formed by our waves in the opposite direction of the trend. becomes active. Then, the appropriate position is taken according to the rise or fall.
Note: I am sure that we will understand what we are talking about more clearly on a visual.
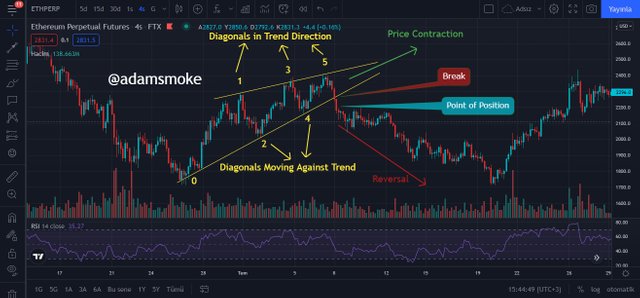
As you can see in the screenshot above, an upward trend has started from our 0 point. Then, our Contractile Diagonal installation was realized. As you can see in this setup, we have 5 waves. The 1,3,5 waves are the mountains that follow the trend and they move in the direction of the trend. Our waves 2 and 4 are moving in the opposite direction of the trend. Then, the shape of these waves resembles a wedge and a price contraction occurs. When our formation is completed, the price has cut our diagonal lines in the opposite direction of the trend. In this screenshot, we take my position as Sell as the market is in an uptrend. Our entry point should be after making sure that the refraction has been finalized, as can be seen in the screen shot.
Why Should We Examine the Contractile Diagonal Model?
The Contractile Diagonal model is an important model. It is similar to many patterns (triangles, Wedges) or Elliot waves in its operation and formation. The purpose of examining such formations and models in general is; It allows us to see many parameters during our trading, such as identifying a trend on the market, identifying trend reversals, overbought and oversold on the price.
In this model, we first determine a trend and make sure that this trend is correct. We are sure that later on, this trend will lessen in strength as we know it will not last forever. At this point in our model, it allows us to determine that the price has started to shrink, to understand that the trend has come to an end, and that there will be a trend change. Therefore, it is an issue that needs to be known and studied. With a little practice, you will all see that it is actually a model that is easy to examine and find.
What Happens in the Market for the Formation of a Contractile Diagonal?
As we mentioned above; The Conctractile Diagonal model is the model that occurs as a result of a price contraction or, in other words, exhaustion. Once a trend starts, it cannot go on indefinitely, every trend gradually loses its strength and changes direction, no matter how strong. When the trend starts to lose strength, the price candles start to narrow and the trend starts to run out. This is because when the price starts to rise or fall, the number of traders buying or selling takes over. Because nobody wants to buy at a high price or sell at a low price. For this reason, every trend loses its power and our model is formed as a result of these exhaustions.
In our Contractile Diagonal model, the point we should not forget is; If the trend is an uptrend, our formed shape is a rising wedge, if the trend is a downtrend, our formed shape is a falling wedge.
Question 2
Give an example of a Contractile Diagonal that meets the criteria of operability and an example of a Contractile Diagonal that does NOT meet the criteria. (screenshot required / Bitcoin not allowed)
Our Contractile Diagonal model has certain interoperability criteria. These criteria are due to the formation of 5 waves in the form of 1,2,3,4,5 and these waves must meet some requirements. Before moving on to the examples, I would like to talk about the wave requirements in this interoperability criterion.
- 1. Wave 1 must be greater than Wave 3.
- 2. Wave 3 must be greater than Wave 5.
- 3. Wave 2 must be greater than Wave 4.
- 4. The trend line drawn from our first diagonal should connect our points 1 and 3. As a general rule, our point 5 should coincide with the line connecting our points 1 and 3. However, sometimes our point 5 may overlap with the line connecting our points 1 and 3.
- 5. The trace formed by the diagonal number 2 should be combined with the diagonal number 4.
- 6. The two diagonal lines we created should converge and intersect at a nearby point.
Note: If even one of these requirements is not met, our model is not set up correctly and cannot serve us properly. Therefore, installations that do not meet these requirements are invalid and a new installation should be sought.
Meets Interoperability Criteria Contractile Diagonal
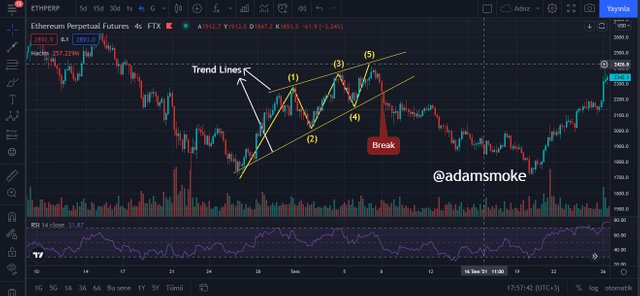
- As we can see in the screenshot above, there is a setup that meets all the requirements.
Does Not Meet Interoperability Criteria Contractile Diagonal
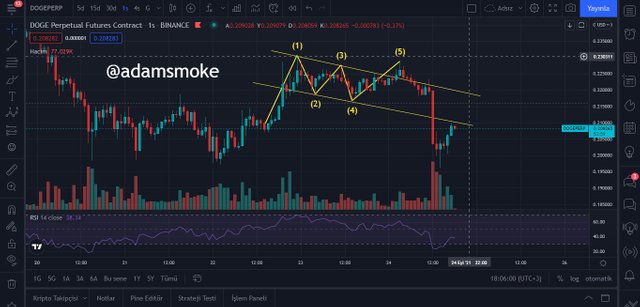
- As we can see in the picture above, the installation does not meet the requirements. It is an ascending wedge that should be formed when there is an ascending trend, so we can say that the direct installation is wrong in appearance. Then when we look at the wavelengths; Our wave 3 is supposed to be bigger than our 5th wave, while our 5th wave is bigger than our 3rd wave.
Question 3
Through your Verified exchange account, perform one REAL buy operation (15 USD minimum), through the Contractile Diagonal method. Explain the process and demonstrate the results and graphical analysis through screenshots. Your purchase data must match your analysis data: such as cryptocurrency and entry price.
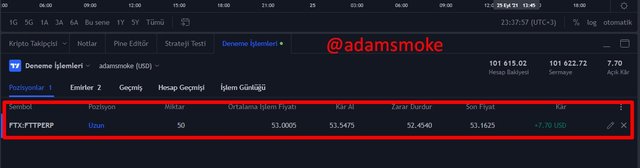
In this section, I will trade with my verified [FTX] (https://ftx.com/tr) platform account.
Sell Position of FTT/USD pair with Contractile Diagonal method
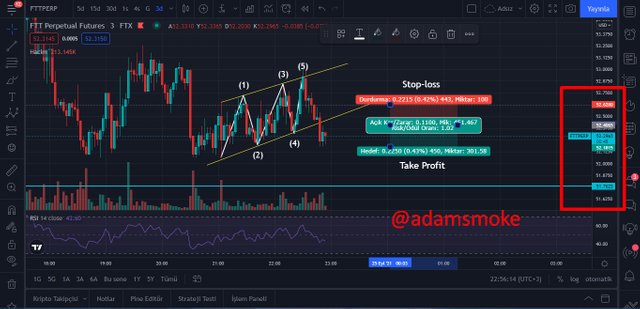
- As you can see in the screenshot above, I have defined an ascending Contractile Diagonal pattern. Then I drew my diagonal lines and numbered them 1,2,3,4,5. I've confirmed that the shape is an ascending wedge.
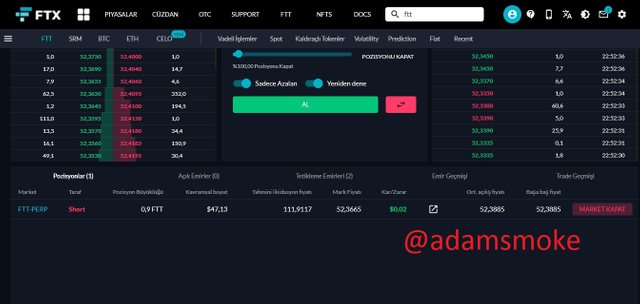
- I verified that it satisfies all the diagonal requirements and began to wait for the breakdown. I was thinking of entering at 52.4065 USD levels if the breakout occurred. There was a quick breakout and I took my Sell position at 52.3885 USD with a market order.
- Later, I set my Take Profit level at 52.1815 USD, near the 2nd diagonal. Then I set a Stop-loss point with the Risk:Reward ratio not exceeding the 1:1 level and determined the level of USD 52,6280.
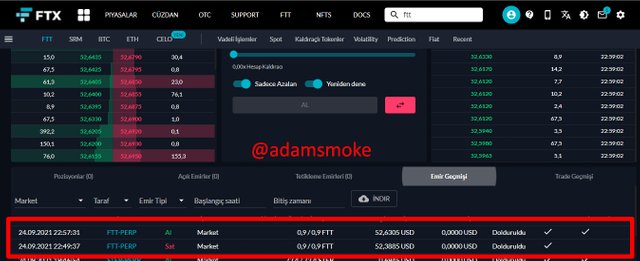
- My position was advancing nicely, but the price bounced back from 52.1745 USD before reaching my Take Profit level. With a very small difference, my trade was not closed and the market turned upside down. Then my trade became a Stop-loss with a small loss.
Question 4
Through a DEMO account, perform one sell operation, through the Contractile Diagonal method. Explain the process and demonstrate the results and graphical analysis through screenshots. Bitcoin is not allowed.
In this section, I will use my Tradingview.com demo account.
FTT/USD pair Buy Position with Contractile Diagonal method
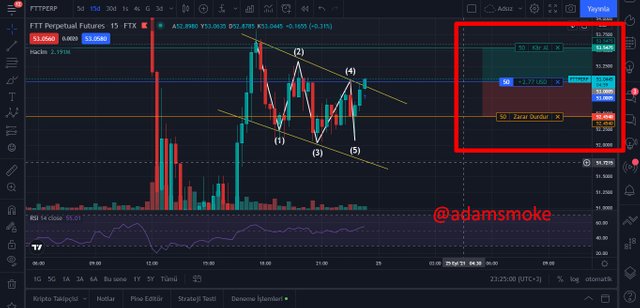
- I have defined an ascending Contractile Diagonal pattern as you can see in the screenshot above. Then I drew my diagonal lines and numbered them 1,2,3,4,5. I confirmed that the shape is a falling wedge.
- I verified that it satisfies all the diagonal requirements and began to wait for the breakdown. The breakout took place and I took my Buy position at the level of 53,00005 USD.
- Then I set myself a take profit level just above the 2 point and placed it at 53.5475 USD.
- Then I set myself a stop-loss point with the Risk:Reward ratio not exceeding the 1:1 level and placed it at the level of 52.4540 USD.
- While I was doing my homework, my position was progressing well.
Question 5
Explain and develop why not all contractile diagonals are operative from a practical point of view. (screenshot required / Bitcoin not allowed)
First of all, in order for the installation to work fully in the Contractile diagonals model, it must comply with all the interoperability criteria we mentioned in Question 2. Otherwise, our trade will not be correct and we may face losses.
Secondly, in each of our trades, the Risk:Reward ratio should not exceed 1:1. In our model, we cannot place the take profit and stop-loss points in a standard ratio of 1:1. Our take profit level should be at or slightly above diagonal 2, and our stop-loss level should be slightly above or below diagonal 5. Since I did not stick to these ratios while doing my homework, as you can see in the 3rd question, my setup did not work and I closed my position with a loss. We can understand this more clearly visually.
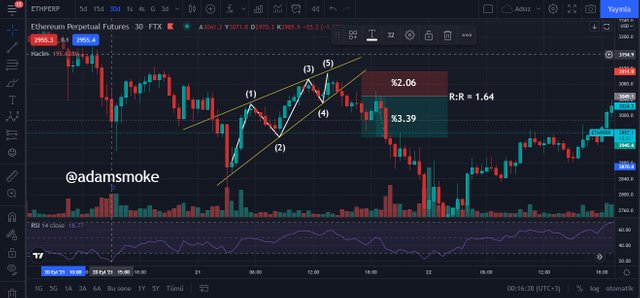
- As you can see in the screenshot above, the Contractile Diagonal pattern meets all the requirements. Our risk:reward ratio is more than 1:1, which is practical for us.
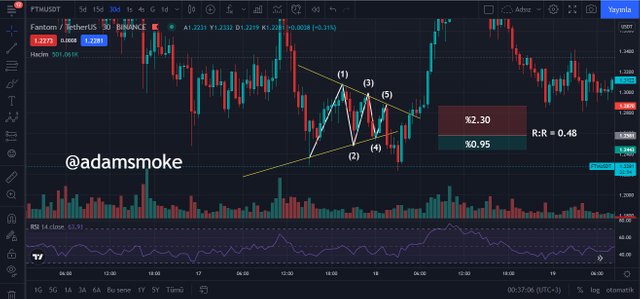
- As you can see in the screenshot above, the Contractile Diagonal pattern meets all the requirements. However, this setup is impractical as our Risk:Reward ratio is less than 1:1.
Conclusion
The Contractile Diagonal model is characterized by many names (Wedges, Wedges). This trading method is generally used to predict trend changes. The Contractile Diagonal method, which we can easily encounter in almost every time zone, is a profitable trade method as long as it complies with the interoperability criteria. However, as we have said many times before, no method is 100% reliable.
In general, finding this setup method, which was easily seen on the chart in the old times, on the instant market and the work of the setup we found was really time-consuming. Even if the installations we found (wedge, wedge) meet all the requirements, they practically lose their functionality when the Risk:Reward ratio is negative. I learned this well in class.
Thank you very much to professor @allbert for this nice lesson. Also, thank you to everyone who read my post. I wish you a healthy and beautiful day.