Crypto Academy for Week 8 - Homework Post for @stream4u | by @adenijiadeshina
PIVOT POINT
A pivot point like the name implies is a point of reference; which is calculated as the average of the market highs , lows and the closing price. So basically the pivot point or price is the point above which the market is up-trending and below which there is a downtrend or a bearish run.
The pivot point gives details about the resistance levels and support levels of the market. It is calculated by using the trade data from previous transactions at certain time intervals with the aim of trying to predict future trend reversals .
PIVOT POINT LEVELS
The pivot point levels are divided into the support and resistance levels . below we will be discussing them in details .
Support levels
The support levels are usually the points along a downtrend or a point at the early stages of an uptrend and a point whereby a trend is expected to be bullish .This levels are generally an oversold region.The market may not always o as planned so the support levels have stages too.
The various support signals are:
S1: This is a point along a bearish trend where it is expected that the market trend reverses and uptrend starts .This first support level is when to buy or enter into that particular market. But things may not go as planned, and another support level is necessary.
S2 : This is the second support level where ,like the first , the market is expected to go on a bullish trend after a possible downtrend and also even this may not be achieved and another support level may be required.
S3: This is another support level whereby a trend reversal to a bullish trend is expected after a possible bearish trend . This support can be surpasses and more losses follows.
Resistance levels
This is a point whereby the trend of a cryptocurrency market is expected to reverse to a downtrend after an uptrend. The resistance levels can also be calculated and , of course , it is not always correct and it may be broken because of the uncertain nature of the cryptocurrency market. The resistance levels are generally an overbought region as more people buy coins , because the are attracted by the uptrend.
Bellow are the various resistance levels of the pivot point indicator:
1)R1: This is the first resistance levels where a market trend is expected to reverse or change from an uptrend to a downtrend, and if this particular support level is exceeded , then more bullish or increase in price continues .This is the point whereby a day trader sells his or her coins.
2)R2: This is the second resistance and ,just like the first, is a point where the market trend is expected to reverse from an uptrend to a downtrend, and if this second resistance is broken, then more bullish trend follows.
3)R3: This is the third resistance level whereby a trend reversal is anticipated after a preserved uptrend . This level, like the other resistance levels is an overbought region.
HOW TO CALCULATE PIVOT POINTS
The pivot point, P =( H+L +C) ÷3
The first resistance level ,R1 = P + (P − L)
The first support level ,S1 = P − (H − P)
The second resistance level ,R2 = P + (H − L)
The second support level ,S2 = P − (H − L)
The third resistance level ,R3 = H + 2(P − L)
The Third support level , S3 = L − 2(H −P)
HOW TO APPLY THE PIVOT POINT IN A CHART
NB: I used trading view.
- Open the chart of any market on trading view
2)croll at the top of the chart and select "indicators "
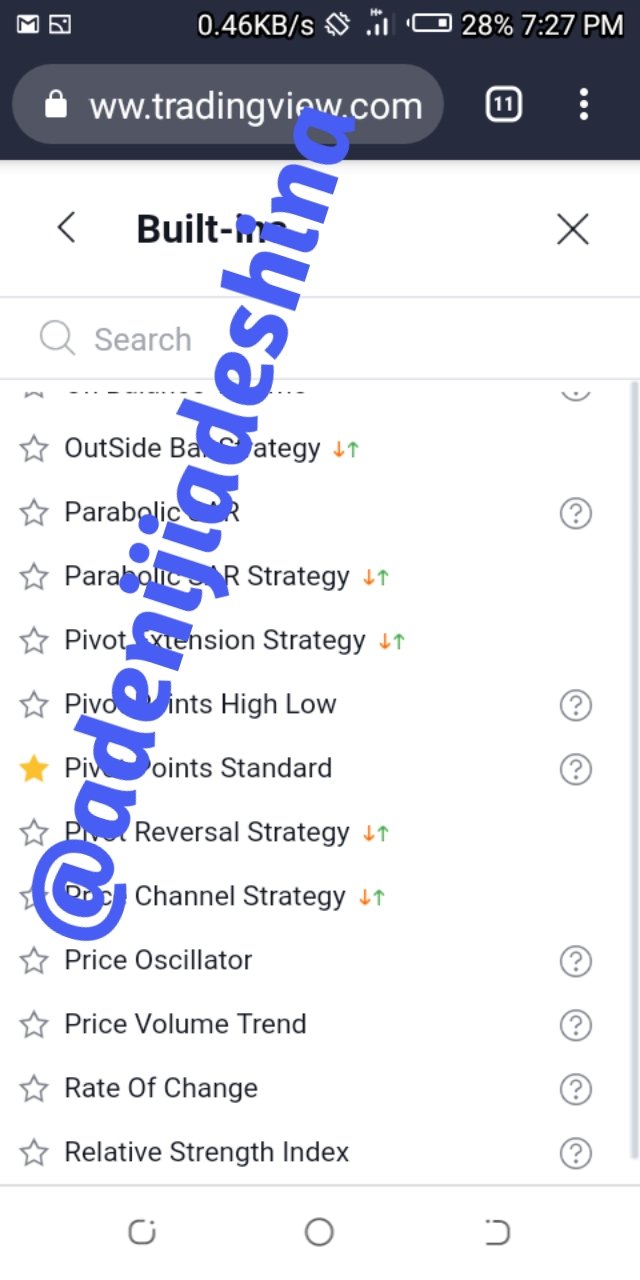
- Click "built in"
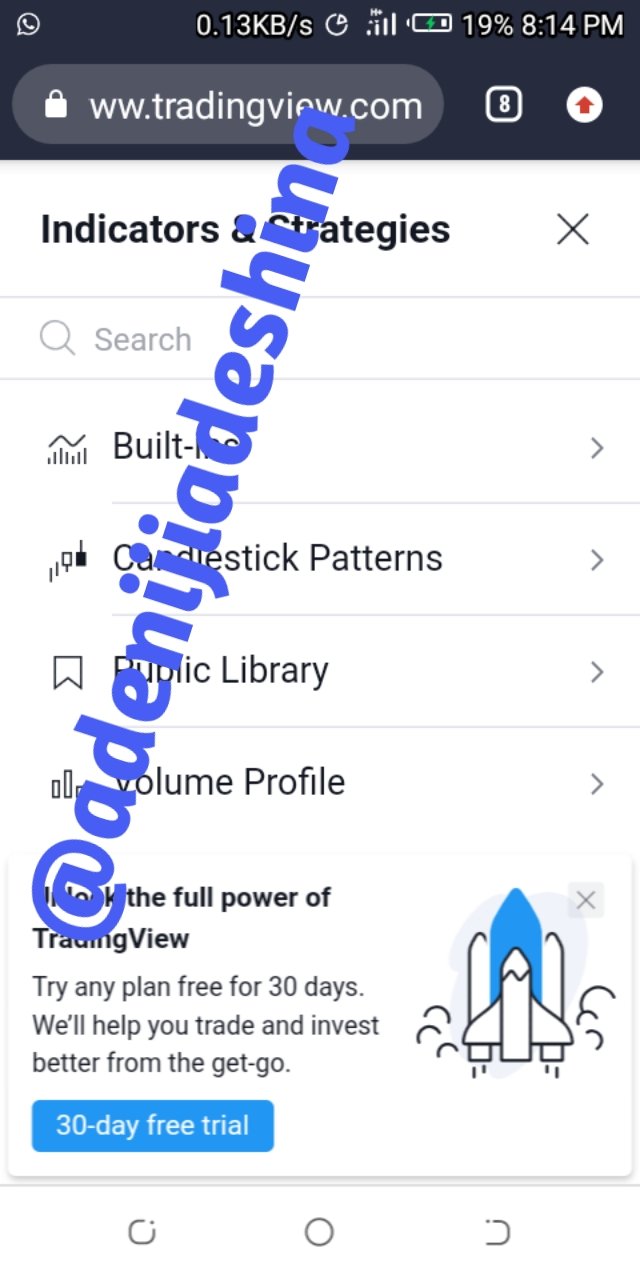
- Select pivot point standard.
HOW PIVOT POINT FUNCTION
Pivot points uses the trade history of previous transactions to tell the current or future resistances or support in a given cryptocurrency market.
This indicator is one of the oldest indicators used and it displays resistance and support signals – at different levels, which tells e trader when best to enter into a particular market ( from conformity to the support signals) and when best to exit the market( when the resistance level is not broken) .
Just like we have stated before , the puvot point indicator makes use of the high price, low price and the closing price of previous sessions to foretell the resistance and support levels.
PIVOT REVERSAL TRADING
To make good profit in the crptocurrency space, one needs to be able to determine when to enter and when best to exit and how to even exit that particular market. So pivot reverse trading is the taking of profits ; that is exiting the market once the resistance signal of the pivot point is not broken.
This can be in two ways , exiting when a bearish trend is expected and entry when the support levels are not broken and an uptrend is anticipated to follow. So summarily , the pivot reverse trading is the using of the various support and resistance signals which are displayed by the pivot point indicator , to avoid losses; for detecting good entry and exit points.
COMMON MISTAKES WHEN USING PIVOT POINTS
When trading with pivot points , one needs to always remember that although it is one of the oldest indicator or trading tool, it can not be relied upon completely just like other technical indicators , because it only tells us what may happen based on history and history may not always be repeated.
Poor knowledge of the demand and supply principle: Many traders have the notion that since they are using a technical indicator, nothing can go wrong and the market just go as predicted, but that is not true.
As a matter of fact , the only sure way to predict the price of a coin is to run a fundamental analysis on the market; check for the real lice demand of the coin and how the supply of the coin is being burned or checked.
Improper adjustment of the resistance and support levels: When setting the pivot points , the various support levels should not be too far apart, same thing goes for the support levels .
When the signals are too far apart, one may not be quick to detect the trend reversals thereby missing opportunities to make good profits. That is one of the reasons why this indicator is best for intraday traders and the time interval chart used here is the 15 minutes interval.
REASONS WHY THE PIVOT POINT INDICATOR IS GOOD
The pivot point indicator has numerous benefits in trading. Bellow are some benefits.
It is easy to calculate: The pivot point of a particular market can be calculated by simply taking the average of the previous high, low and closing price( (HIGH + LOW+CLOSSING PRICE)/3) , although we have exchanges that can do the math automatically, it is still easy to calculate manually.
It helps to determine trend reversals: This indicator is very effective ; but not always accurate , in detecting when the market will change course. Because of its multiple support and resistance levels , it makes it very good at detecting a trend reversal even after the first or second resistance and support levels are beoken.
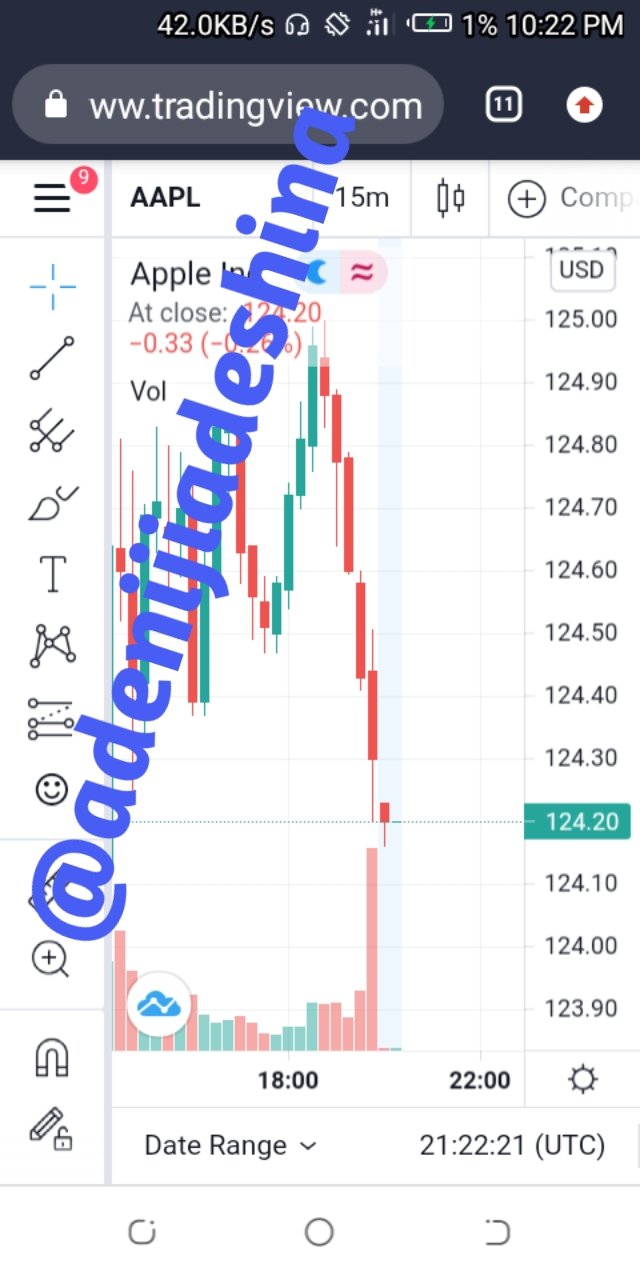
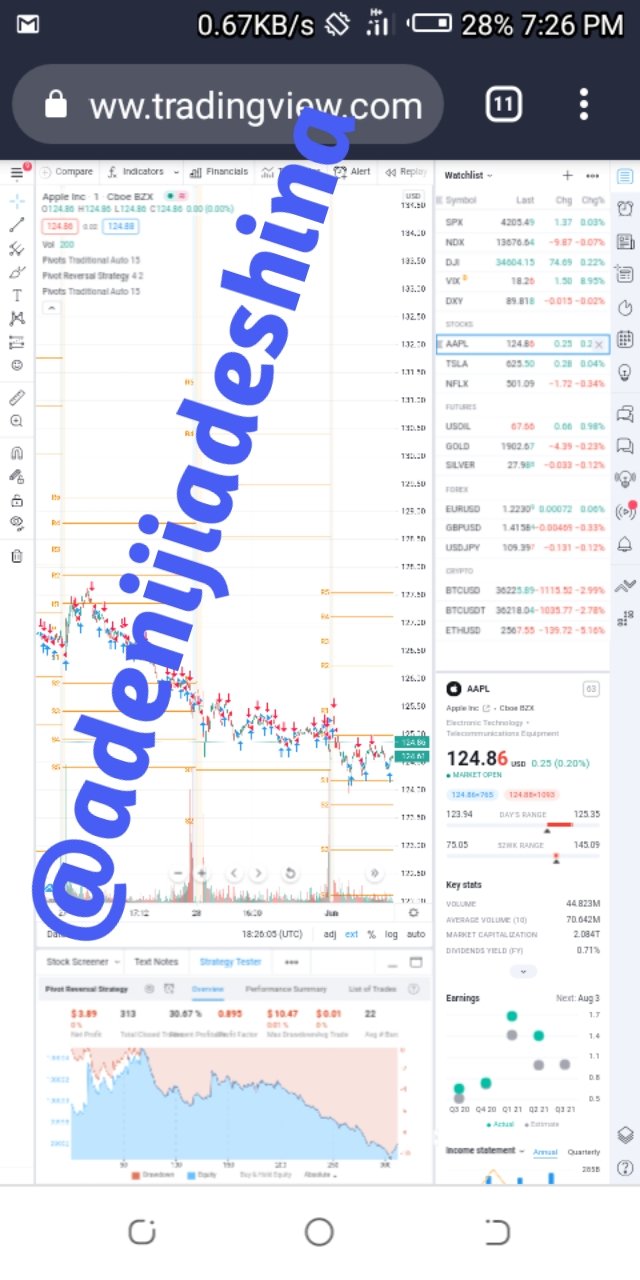
ANALYSIS OF THE APPLE INC. USING THE PIVOT POINT
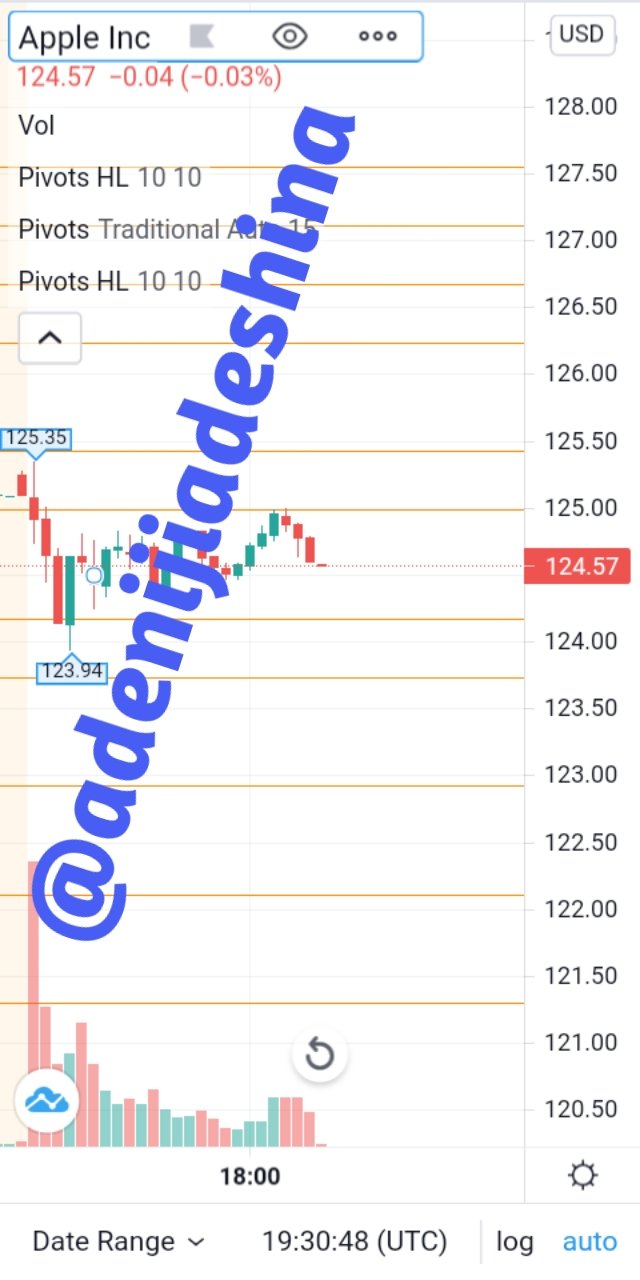
It can be seen that the price fluctuates about a pivot point of $124.57
And from the above chart ,the price of the asset is decreasing and one would expect a trend reversal after it reches the point of its previous low 2hich is at a price of $123.94. So at the end of today it should not break the support and so it should still be about $123.75
DOGE COIN
Doge coin is a coin that has shown some promise a couple months back.I would like to predict this coin because it is one that, although it's price is low right now, it has enjoyed high prices compared to some other coins within the same time frame .
It was was taunted to be the future . In recent weeks, we have seen the price plummet and it is as though the price won't rise again.
Technical analysis
Technical analysis is the use of previous trade data to predict the future performance of a particular coin. Data such as Volume , highs and lows , etc are used to predict the future price.
TECHNICAL ANALYSIS OF DOGECOIN
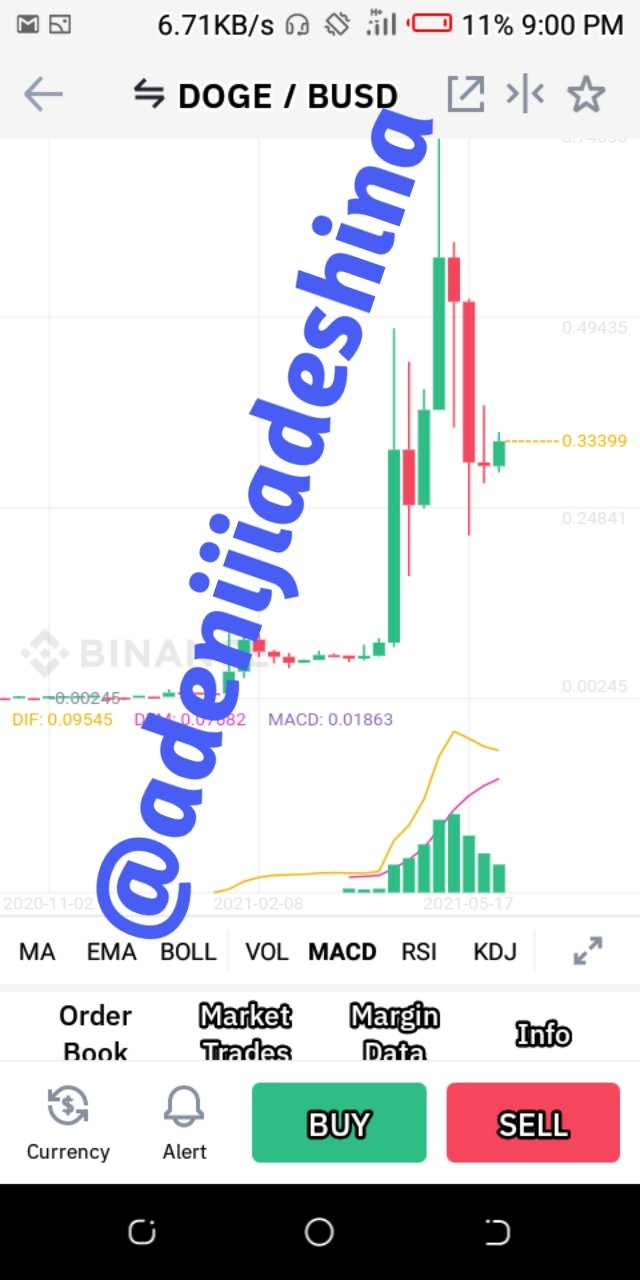
Bellow is a technical analysis of Doge coin using the MACD indicator.
From the weekly chart above it can be seen that the MACD line crossed the signal line and moved above it and an uptrend followed and from the histogram above the zero line , the bar was reducing and the both lines converging, so a downtrend is inevitable in the next one week, I predict a possible low of $0.3 and a high of $0.4
Hi @adenijiadeshina
Thank you for joining The Steemit Crypto Academy Courses and participated in the Homework Task.
Your Homework Task verification has been done by @Stream4u, hope you have enjoyed and learned something new.
Thank You.
@stream4u
Crypto Professors : Steemit Crypto Academy
#affable