Crypto Academy / Season 3 / Week 2 - Homework Post for @reminiscence01
THE JAPANESE CANDLE STICK
The Japanese candle stick is a marvelous device for crypto traders, its capacity in the crypto market has made it simpler and more advantageous for traders in the crypto world to have the option to take an interest and partake in trading. It very well may be perceived with a tiny bit of study.
The most well known kind of candlestick is the Japanese candle stick.
The Japanese candle stick can be referred to as an instrument that is utilized to distinguish between market trend and can likewise be utilized to settle on choices or make decisions relating to the crypto market.
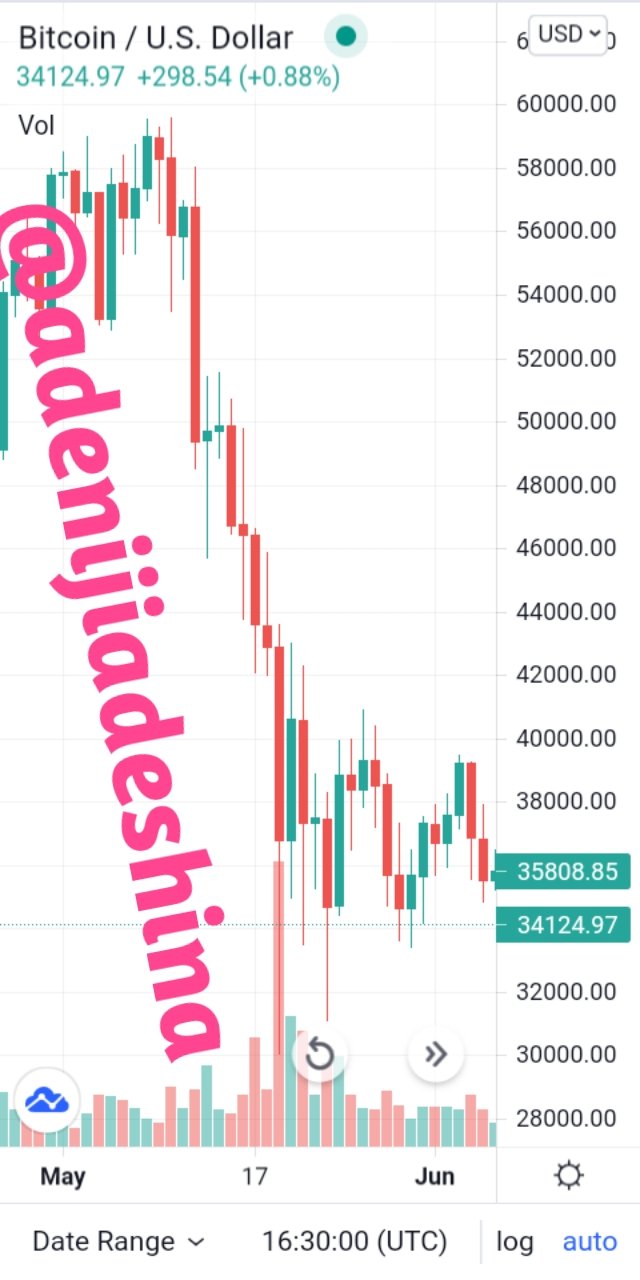
A crypto broker augments this instrument as a method for observing the cost of the crypto market. The base of the candle stick is the opening price, and the top is the closing price for a bearish trend( green candle) and the top is the open price and the base the closing price for a bearish trend ( red candle),each candle stick has its own colour, these colours can be altered to suit the clients inclination yet the default colour for the candle sticks are green and red( in most exchanges).
One of the best benefit of utilizing the Japanese candle stick is that they make arrangement for a graphical representation of the demand and supply and also the behavior of traders and this gives details on when to enter and exit the market to maximize profits or limit losses.
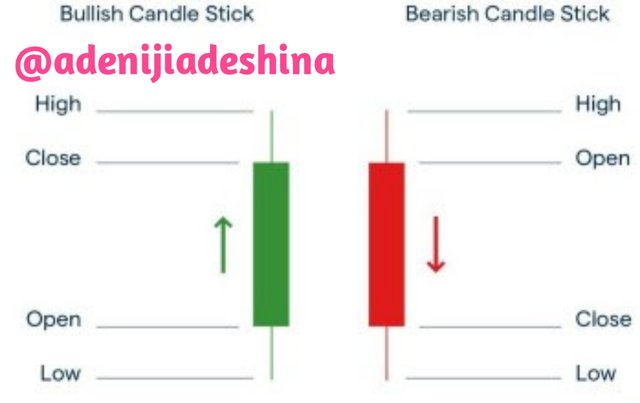
The colours as displayed in the picture above address:
GREEN:
this is known as the bullish Japanese candle stick, it is utilized to demonstrate an increment in the cost of a token.
RED:
the red candle stick is alluded to as the bearish Japanese candle stick and it is utilized to show the fall in cost of a token.
Both the bullish candle and the bearish candle have what is refered to as a wick and furthermore has a shadow at the top and lower part of it, this connotes or portrays the highest point that the cost of an asset achieved at that specific time span and the absolute bottom that the cost of an asset accomplished at that specific timeframe.
At the point when the wick is short, this advises us of the exchanging exercises that was completed generally between the open price and the closing price at the specific time frame.
At the point when the wick is long, it reveals to us that the trade activities of that specific asset have circumvent the limits of the open price and closing price .
When there is a long wick at the highest point of the candle stick; it reveals to us that the high is exceptionally solid however the closing price is low, this is to say that the purchasers rule the significant piece of that meeting yet even at that the venders had the option to cause a value decrease yet when there is a long wick at the lower part of the candle stick,it suggests that albeit the merchants were the ones overwhelming the market, the purchasers had the option to push up the costs.
The Japanese candle stick is utilized to break down the cryptocurrency market. The Japanese candle stick has the open, the closing, the high, and the low price features.
Aside from the Japanese candle stick there are a few different outlines that can be utilized for analysis in cryptocurrency like the line diagram, the point and figure graph, the Heikin Ashi diagram, the Area diagram, the Baseline diagram, the Kagi graph, the Range Chart, the line break outline, the renko outline and the bar diagrams. In any case, I will be discussing only two, the line diagram and the point and figure chart.
THE LINE CHART
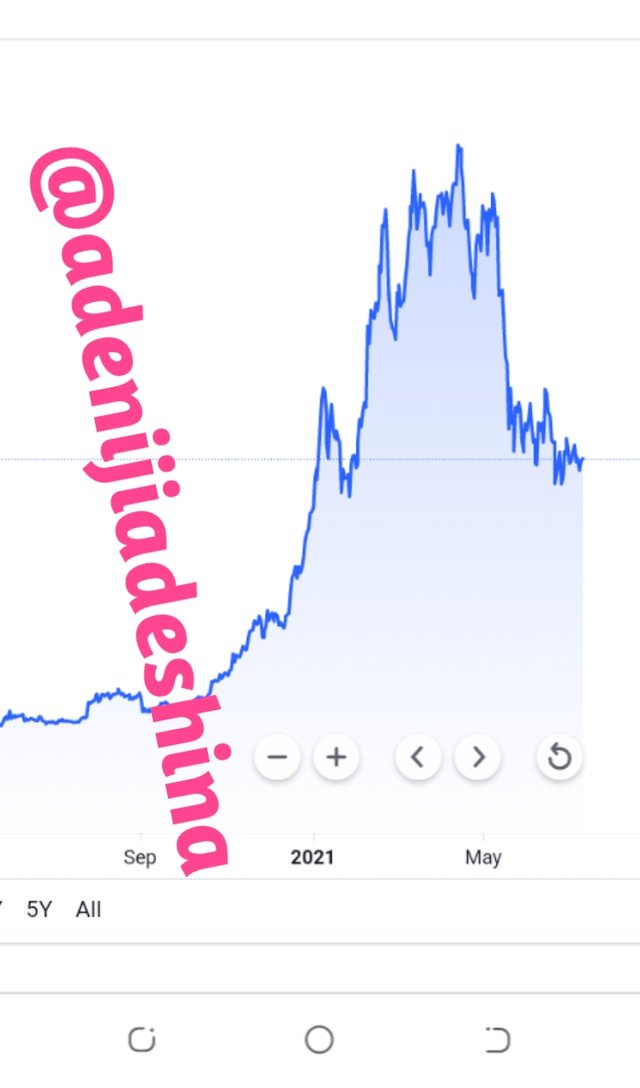
Like the name infers, the line graph is comprised of a solitary line, and this sort of diagram just shows us what the end value that was exchanged inside a timeframe is, it best suits traders who have interest in day trading.
Albeit this type of chart is supposed to be the easiest, it is likewise inadequate on the grounds that the lone data it gives us is the end price of a token and one needs all information possible , like what happened in between, everything it does is summing up the development of the cost.
THE POINT AND FIGURE CHART
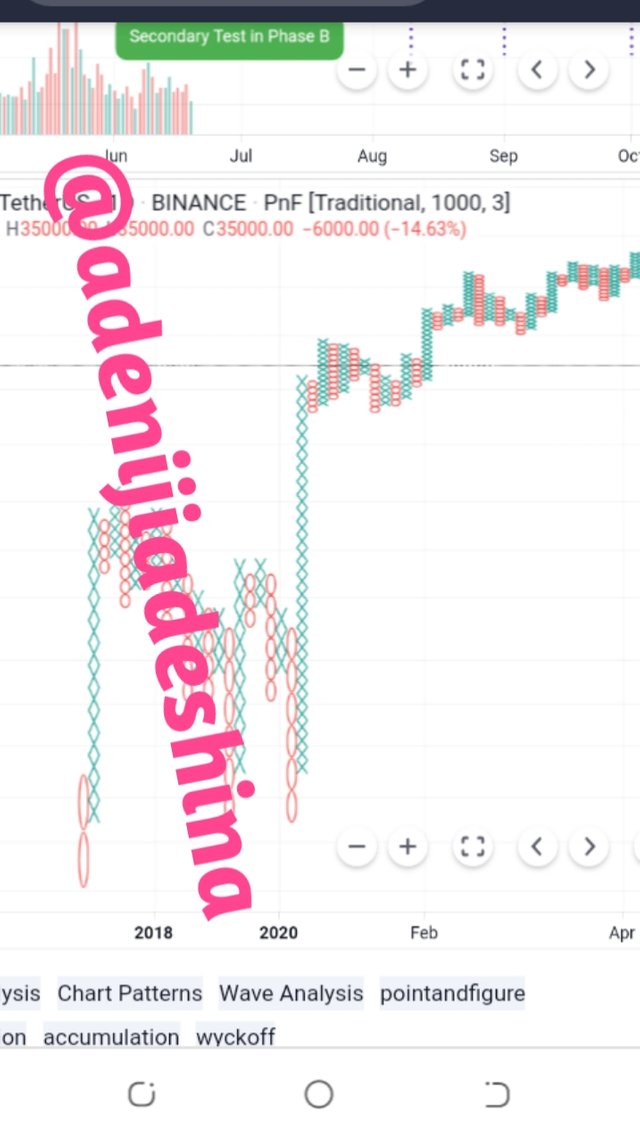
Actually like the line graph is most appropriate to day traders, while the point and figure chart is most appropriate for long term or trend traders. We can say that the point and figure outline is probably the most ideal ways by which we can decide a solid entry and exit point in the crypto market.
Actually like in the graph above, the point and figure outline has two highlights, the X element (green) and the O include (red). The X element demonstrates that the cost of a token is rising while the O token shows that the cost of the token is falling.
WHY USE THE JAPANESE CANDLESTICK?

Among numerous reasons why the Japanese graph is generally utilized by crypto traders, bellow are a few.
The Japanese candlestick is generally utilized by traders on account of its exact method of introducing informations on the crypto market, the informations given by the Japanese candle stick are exact and very much definite about the value developments of a token.
The Japanese candle stick is straightforward, as the main thing to know and comprehend is the candle stick that addresses a bullish trend and the one that addresses a bearish trend. This is to say that the Japanese candle stick doesn't need an exceptional preparing to comprehend as even a newbie can read one.
The Japanese candle stick helps the dealer in perceiving bullish and bearish trends, this assists the broker with turning away dangers, this assists the merchant with realizing when to settle on a superb trading decision, avoiding loss and augmenting benefits.
The Japanese candle stick discloses to us the condition of the market at a solitary look, it's anything but a reasonable bearing on where the market trend is going.
USES OF A BULLISH AND BEARISH CANDLE
The Japanese candle stick is comprised of a few significant parts or highlights which will be considered bellow.
HIGHS:
this is one of the significant parts to comprehend prior to utilizing the Japanese candle stick, It is the highest price of a token or asset withing a certain time frame chart. It is a very good point to set the resistance levels.
LOWS:
This is the lowest price the cost of an asset reached a previous trade session; depending on your trading strategy. Generally a low gives a good point to set support levels .
OPEN PRICE:
this is the initial cost for a token, it is the main record of the trading cost for an asset during a specific time span.
CLOSING PRICE:
In contrast to the open price, this is the cost for a token at the end of a trading session. This price is particularly helping in determining the performance of a coin within a time frame of interest.
COLOUR:
Like in the figure above, the Japanese candlestick is comprised of two (2) colors which can be altered by the dealer to suit their taste. Green shows purchase while the Red connotes sell, likewise the red colour shows a downtrend or bearish trend while the green colour shows an uptrend or bullish trend.
THE MOVEMENT:
the Japanese candle sticks primarily is a technical analysis tool which demonstrates the market trends at that specific time.
Aside from the above recorded highlights of the Japanese candle stick outline, we additionally have the shadow and the body; the shadow is utilized when the cost of an asset isn't chosen while the body is utilized to demonstrate the distance covered by the cost at a specific point on schedule.
The body Is the distance that can be seen between the open and the nearby component of the Japanese candle stick graph. We likewise have the candle range which is the distance between the base cost of an asset and the greatest cost of that asset.
CONCLUSION
Seeing how to utilize the Japanese candle stick is a fundamental necessity for any merchant who needs to flourish in the crypto market. Since the time the origin of this candle stick, its notoriety and unmistakable quality has been on the ascent.
Despite the fact that it's anything but to say that different outlines are not significant for a broker in breaking down the crypto market, contingent upon the sort of exchange a dealer needs to complete, you can utilize different graphs.
I more grounded trust and accept at this point that you have acquired a serious significant information on what's going on with the Japanese diagram and how to augment it's anything but a more noteworthy yield in your crypto exchanges.
Hello @adenijiadeshina, I’m glad you participated in the 2nd week of the Beginner’s class at the Steemit Crypto Academy. Your grades in this task are as follows:
Recommendation / Feedback:
You did an amazing work and you explained Japanese candlestick chart in detail. Thank you for submitting your homework task.
@sapwood - please would you take a look at this account (@adenijiadeshina) and @adedapo-glory.
There are some interesting similarities...
Thank you