Steemit Crypto Academy Season 2-Week6 | Homework Post for [Crypto Professor @kouba01]
What is the MACD indicator simply? Is the MACD Indicator Good for Trading Cryptocurrencies? Which is better, MACD or RSI?
The moving average convergence divergence (MACD) is a straightforward but powerful trading indicator for identifying new patterns and determining if they are bullish or bearish. Gerald Appel created the MACD indicator, a growing market momentum indicator/oscillator, in the late 1970s. It is calculated on price data that is plotted as a time series that is used to evaluate the power and intensity of a cycle.
Is the MACD Indicator Good for Trading Cryptocurrencies?
The MACD will include a graphic snapshot to aid in pattern analysis, enabling traders to quickly review charts. That makes it a useful technical analysis tool, particularly given the wide range of financial instruments available to traders today, including the forex market, indices, commodities, and stocks. On our Next Generation website, you will learn how to read and use the MACD for technical trading.
Yes, the MACD indicator is really useful for cryptocurrency traders. Before reading the author's message, I had little idea what MACD was, but after learning about it from the talk, I went to the crypto market background and enabled the MACD, and I discovered that it worked for the majority of the time.
Which is better, MACD or RSI?
The RSI and MACD indexes are both essential in price forecasting. The beneficial aspect of the number of signals is the probability of obtaining reliable market forecasts. We must determine how many measures are sending the same signal to the specific pattern.

How to add the MACD indicator to the chart, what are its settings, and ways to benefit from them? (Screenshot required)
As seen in the below picture, the first move is to open the chart and click the technical indicator adder.
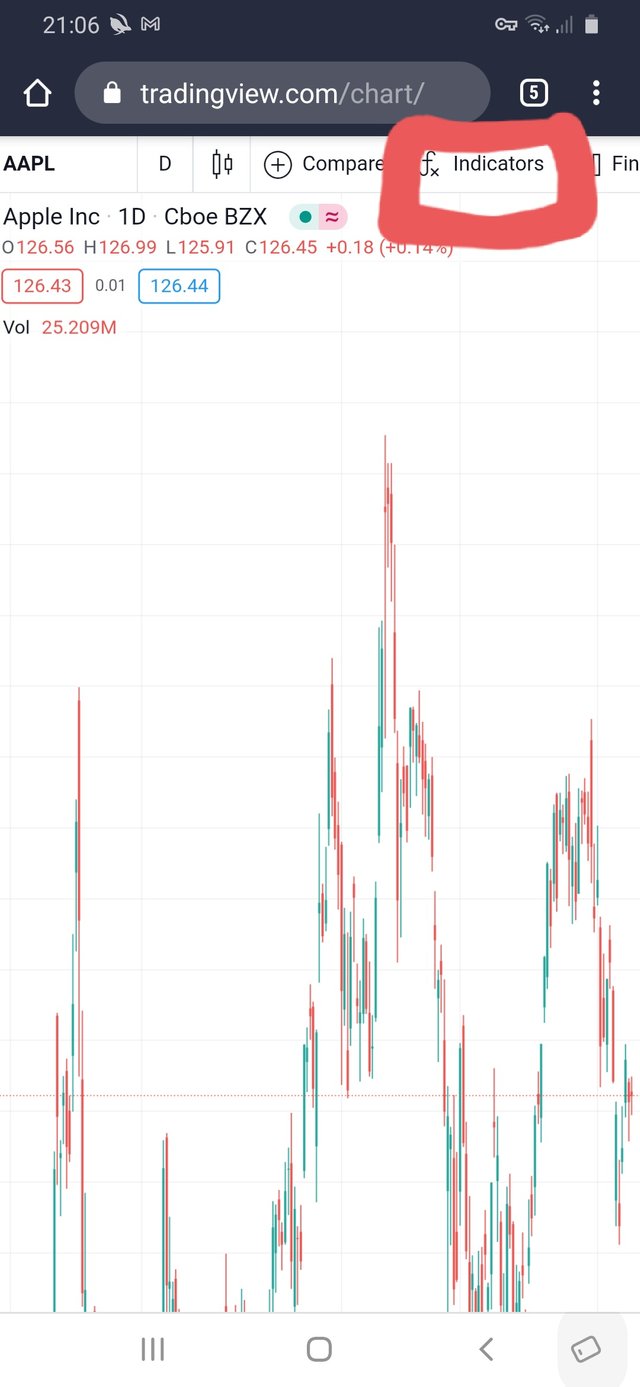
when you press the indicator adder. And we need to apply the Moving Average Convergence and Divergence, form MACD here. If you need to use another measure, do so here. select the necessary indicator, and click it.
.jpg)
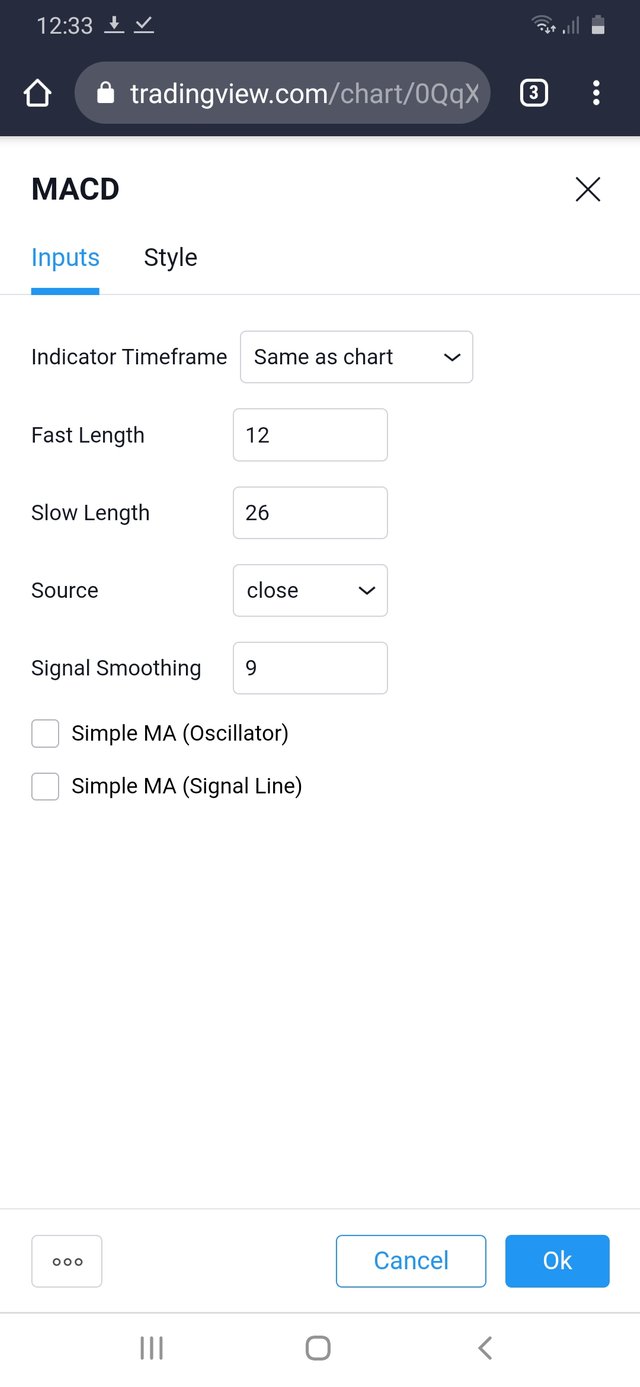

How to use MACD with crossing MACD line and signal line? And How to use the MACD with the crossing of the zero line?
• MACD line.
• Signal line.
• Zero line.
• Histogram.
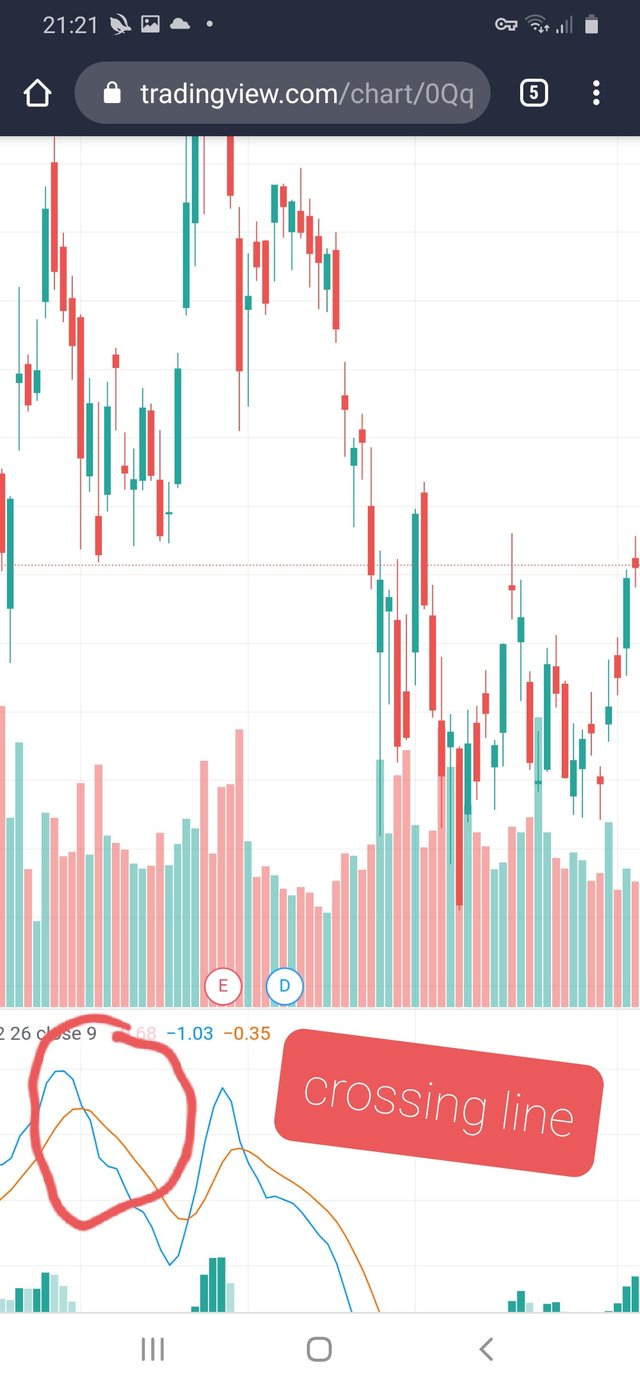
As you can see in the screenshot below, the blue MACD line crossed the red signal line, indicating that a sector reversal is imminent. As a result, the price decreased. Note: This is one of the things to think about while using MACD.
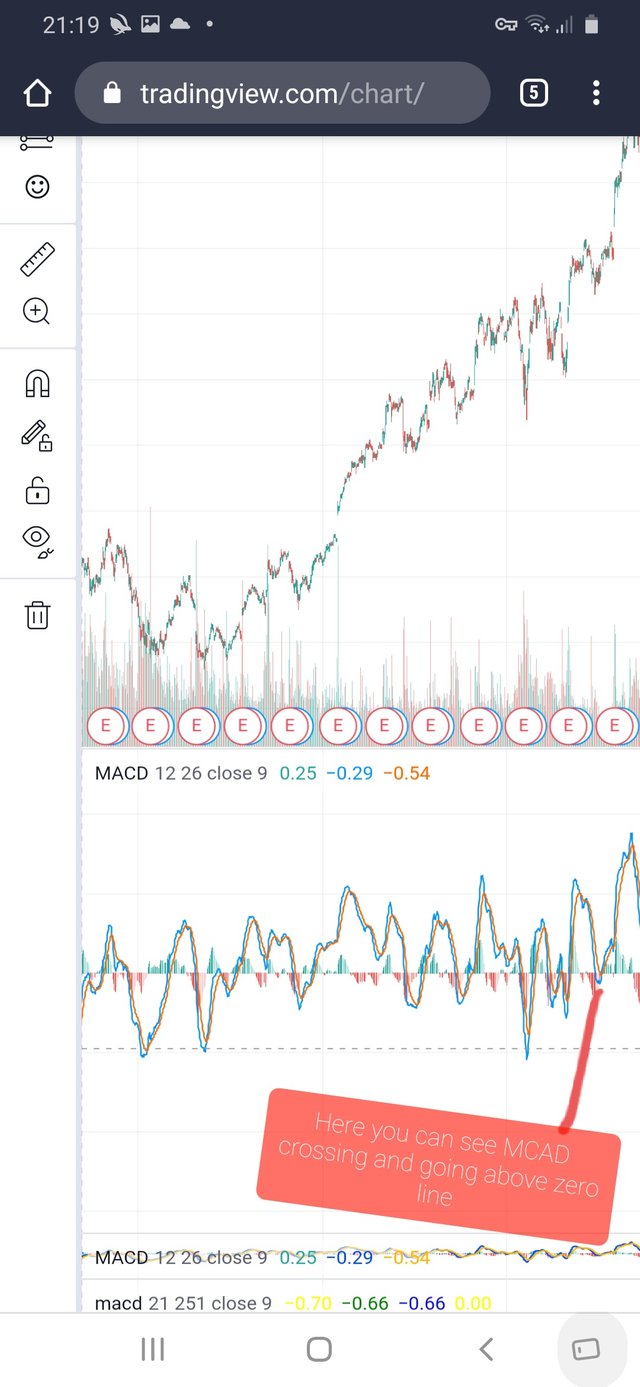
MACD with the crossing of the zero line is also a factor that needs to consider during the MACD analysis

The elements of MACD and their settings have been established in this post. We'll now talk about how to use the MACD cross to make trading decisions.
When the MACD line crosses above the signal line for a bullish reversal, it indicates a shift in momentum to the upside and a price reversal. This cross can be used as a buy signal by traders looking for a buy position. The BTC/USD chart below shows an example.


How to detect a trend using the MACD? And how to filter out false signals? (Screenshot required)
As previously said, the intersection of two MACD lines and the signal line at the zero line, as well as the crossing of two MACD lines and the signal line, are significant here. When this occurs, the economy will see a reversal.
Place a line on the chart connecting the higher high or lower low of the price chart and the MACD chart, and check to see if the flow was in the opposite direction, that is, if the price chart shows a down line and the MACD shows an up line, it is a good indicator of a bullish market.

False MACD signals are filtered out.
Indicators do not always provide a clear signal to enter a market. They can sometimes give false signals, causing a trader to trade against the trend. MACD is a lagging indicator, and understanding this concept will show you that it does not always provide accurate signals.
We occasionally see the MACD line cross over the signal, indicating a bullish reversal, but we usually see the price move in the opposite direction of the MACD signal. Divergences are the most effective way to filter this signal. Divergences can assist in filtering out false MACD signals and converting them to a valid signal. On the XRP/USD chart, you can see an example of bullish divergence.
We need to hear about more metrics to root out the misleading signals. We need to look for the same signal that confirms the pattern is opposite.

How can the MACD indicator be used to extract points or support and resistance levels on the chart? Use an example to explain the strategy. (Screenshot required)


The blue oscillating line is the MACD line.
The Red oscillating line is the Signal line.
The green bars on and below the zero line is the histogram line.

Review the chart of any pair and present the various signals from the MACD. (Screenshot required)
On XRP/USD, we can see price rejection at a previous resistance area where the MACD line previously crossed below the signal line; however, while price is rejecting this area, the MACD line has not crossed below the signal line to indicate a sell signal. Only when the MACD has crossed below the signal line can we consider selling.
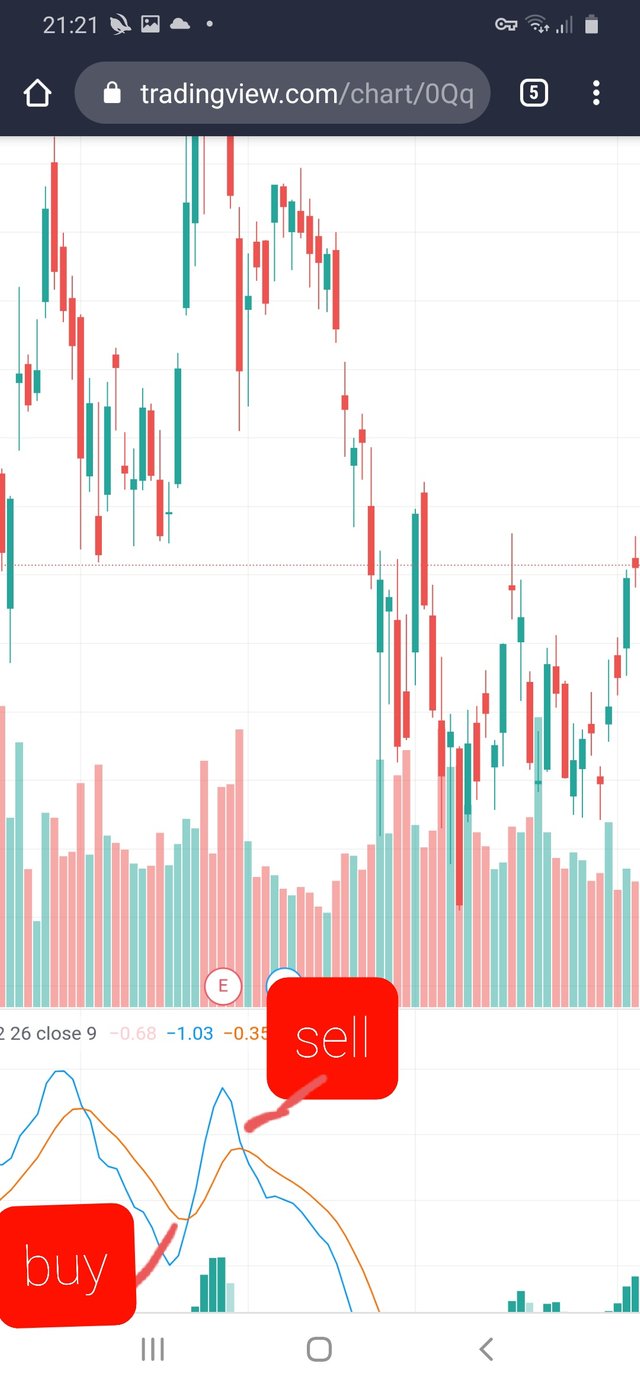
As the MACD line crosses over the signal line and the stop loss is positioned above the high point of the resistance field, it signals a good entry opportunity.

Conclusion
It's been a long process from RSI to MACD, which began a few weeks ago. This week will provide me with a chance to learn more about some of these metrics. I've never heard of such metrics, and I've never clicked on such choices. I not only understand but also recognize how the MACD and Signal lines travel between the zero lines.Moving Average Convergence and divergence is much indeed indicator it is suitable for all the stock crypto traders.

Hello @adnanyassin,
Thank you for participating in the 6th Week Crypto Course in its second season and for your efforts to complete the suggested tasks, you deserve a 3/10 rating, according to the following scale:
My review :
An article with poor quality content, your writing style lacks a clear methodology, so we find ideas scattered with no links and what makes your answers inaccurate. Try doing more research and improving your writing style by reading good articles and citing their method until you learn a lot.
Thanks again for your effort, and we look forward to reading your next work.
Sincerely,@kouba01